4

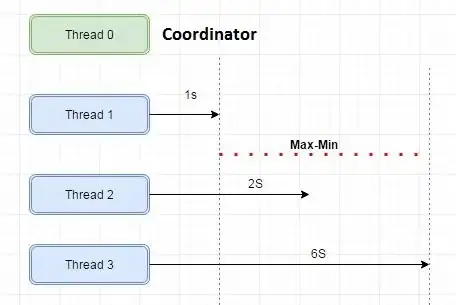
I have many parallel executing queries in my SQL Server database. I need to find out queries where the difference in time for the longest thread and the shortest thread is high (excluding co-ordinator thread). In fact, I need to find top 10 such queries with highest difference (from the queries that are getting exeuted in the span of 1 hour). How to track this information in SQL Server?

Note: I am using SQL Server 2012.

enter image description here

References

  1. SQL Server 2012’s Information on Parallel Thread Usage - Joe Sack
  2. Parallel Execution Plans – Branches and Threads - Paul White
LCJ
  • 900
  • 3
  • 7
  • 30

3 Answers3

1

One thing to note a query execution does not go in parallel for all operators. It is decided per operator cost and your setting for 'Cost Threshold of Parallelism' and 'Max Degree of Parallelism'.

In theory you are looking at operations (operator with in execution plan) that had the highest delta in runtime between threads.

Depending on how much you collect, I suggest you create some indexes to speed things up. Let me know if you have any issues running my code.

/*============================================================================
PerThreadcollection.sql
Written by Taiob M Ali
SqlWorldWide.com

This script will show where queries (certain tasks within execution plan) are running 
in parallel and difference in time for the longest thread and the shortest thread is high (excluding co-ordinator thread).  

Instruction to run this script
--------------------------------------------------------------------------

--You will have to adjust @howManyTimes Variable values based on your requirements
--You will have to adjust @WaitSec Variable values based on your requirements

============================================================================*/

USE [DbaDB]
GO
--Creating table to hold raw data
SET ANSI_NULLS ON
GO

SET QUOTED_IDENTIFIER ON
GO

CREATE TABLE [DbaDB].[dbo].[PerThreadcollection](
    [timestamp] [datetime] NOT NULL,
    [session_id] [smallint] NOT NULL,
    [status] [nvarchar](30) NOT NULL,
    [command] [nvarchar](32) NOT NULL,
    [blocking_session_id] [smallint] NULL,
    [wait_type] [nvarchar](60) NULL,
    [exec_context_id] [int] NULL,
    [task_state] [nvarchar](60) NULL,
    [text] [nvarchar](max) NULL
) ON [PRIMARY]

GO

--Collecting raw data
DECLARE @howManyTimes int=0
DECLARE @WaitSec char(2) = '30'
DECLARE @Delay char(8)
SET @Delay = '00:' + '00:' +@WaitSec

WHILE(@howManyTimes<101)
BEGIN
INSERT INTO [DbaDB].[dbo].[PerThreadcollection]

SELECT 
        GETDATE(),
       er.session_id, 
       er.status, 
       er.command, 
       er.blocking_session_id, 
       er.wait_type, 
       ot.exec_context_id, 
       ot.task_state, 
       st.text 
FROM   sys.dm_exec_requests er 
       JOIN sys.dm_os_tasks ot 
         ON ( er.session_id = ot.session_id ) 
       CROSS apply sys.Dm_exec_sql_text(er.sql_handle) st 
WHERE  er.session_id IN (SELECT session_id 
                         FROM   sys.dm_os_tasks 
                         GROUP  BY session_id 
                         HAVING Count(exec_context_id) > 1) 
WAITFOR DELAY @Delay
SET @howManyTimes = @howManyTimes + 1
END
GO

 ;WITH MinExecution (sessionID, execContextId, queryText, mintime) 
 AS
 (
  Select session_id, exec_context_id, [text], MIN(timestamp) AS [MinTime]
  FROM [DbaDB].[dbo].[PerThreadcollection]
  WHERE exec_context_id <>0
  GROUP BY session_id, exec_context_id, [text]
),

MaxExecution (sessionID, execContextId, queryText, maxtime) 
 AS
 (
  SELECT session_id, exec_context_id, [text], MAX(timestamp) AS [MaxTime]
  FROM [DbaDB].[dbo].[PerThreadcollection]
  WHERE exec_context_id <>0
  GROUP BY session_id, exec_context_id, [text]
)

SELECT sessionId, queryText, (MAX(duration)-MIN(duration)) AS [deltaInSeconds] from 
(
SELECT 
  mi.sessionID, mi.execContextId,mi.queryText ,DATEDIFF(ss, minTime, maxTime) AS [duration]
FROM MinExecution AS mi
JOIN MaxExecution AS mx
ON mi.sessionID=mx.sessionID
  AND mi.execContextId=mx.execContextId
  AND mi.queryText=mx.queryText) as t
GROUP BY sessionId, queryText 
ORDER BY [deltaInSeconds] DESC

GO
SqlWorldWide
  • 13,687
  • 3
  • 30
  • 54
1

What is the (practical) difference between the approach you want to take (i.e. max difference between shortest and longest threads) and the approach of looking for the longest running queries based on their start time? The only difference would appear to be the amount of time it takes for Thread 1 to start. So, assuming that it is fairly consistent (i.e. minimal difference) across queries in terms of how long it takes for Thread 1 to start, then that amount of time would cancel out of being a relevant factor in determining longest running queries.

Also, what exactly is meant by "difference in time" between shortest and longest threads? Do you mean start time to end time (which increases even when the thread is "suspended" or "sleeping") or only active, processing time (which would take into account time spent in non-running states)? This distinction might not matter, actually, as it does not seem possible to get either via a query. There are only a few DMVs that even have a "context_id" (or similar) field, and none of them report either the start_time or elapsed_time:

SELECT OBJECT_NAME(sac.[object_id]), sac.[name]
FROM   sys.all_columns sac
WHERE  sac.[name] LIKE N'%exec%context%'
AND    OBJECT_NAME(sac.[object_id]) NOT LIKE N'dm[_]pdw[_]%'
ORDER BY OBJECT_NAME(sac.[object_id]), sac.[name];

Returns:

dm_db_task_space_usage   exec_context_id
dm_os_tasks              exec_context_id
dm_os_waiting_tasks      blocking_exec_context_id
dm_os_waiting_tasks      exec_context_id
dm_tran_locks            request_exec_context_id

Also, there is no indication in either of the two reference links posted in the question that timing per thread is tracked, or at least reported. But again, even if there was, I don't see how that would give you any truly meaning information to make a decision on.

It seems like your best bet is to start with something like the following to find queries (well, query batches) that are taking the longest on an individual query / batch basis:

SELECT qstat.*
FROM   sys.dm_exec_query_stats qstat
ORDER BY qstat.total_worker_time DESC;

Sorting by total_worker_time instead of total_elapsed_time should account for time spent waiting (i.e not actively running).

Solomon Rutzky
  • 70,048
  • 8
  • 160
  • 306
0

Based on the limited information you've provided, this approach might do what you need. Download and install SP_WhoIsActive.

Refer to this link for information on capturing the information from sp_WhoIsActive into a temp table

Below is an example of calling sp_WhoIsActive and capturing the information into a temp table. This SP returns a 'duration' in the first column that you could sort desc.

IF OBJECT_ID('tempdb.dbo.quick_debug') IS NOT NULL
    DROP TABLE tempdb.dbo.quick_debug
GO

DECLARE @s VARCHAR(MAX)

EXEC master..sp_WhoIsActive @format_output = 1
    ,@return_schema = 1
    ,@schema = @s OUTPUT

SET @s = REPLACE(@s, '<table_name>', 'tempdb.dbo.quick_debug')

EXEC (@s)
GO

EXEC master..sp_WhoIsActive @format_output = 1
    ,@destination_table = 'tempdb.dbo.quick_debug'

--Delete from temp table the rows that don't match the information
--you're looking for.
SELECT TOP 10 *
FROM tempdb.dbo.quick_debug
ORDER BY 1 DESC
Scott Hodgin - Retired
  • 24,062
  • 2
  • 29
  • 52