3

My server load is a bit high when many users are on and i'f like to know if i can get better results by tweaking mysql settings, this is a dedicated server and it seems that problems start when 500 users connect at the same time.

Some info about the server:

cat /proc/cpuinfo

processor       : 0
vendor_id       : GenuineIntel
cpu family      : 6
model           : 60
model name      : Intel(R) Xeon(R) CPU E3-1246 v3 @ 3.50GHz
stepping        : 3
microcode       : 30
cpu MHz         : 3501.000
cache size      : 8192 KB

MEMORY:

enter image description here

CENTOS ver:

Linux srv 2.6.32-642.el6.x86_64 #1 SMP Tue May 10 17:27:01 UTC 2016 x86_64 x86_64 x86_64 GNU/Linux

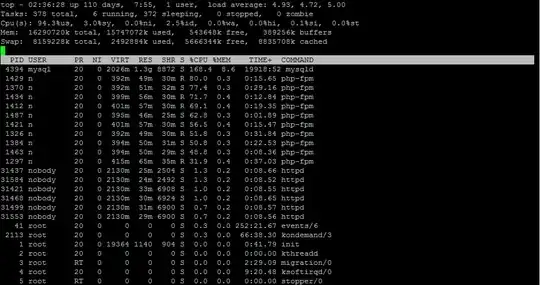
TOP COMMAND:

enter image description here

this is mysqltunner log:

# perl mysqltuner.pl
>>  MySQLTuner 1.6.12 - Major Hayden <major@mhtx.net>
>>  Bug reports, feature requests, and downloads at mysqltuner.com
>>  Run with '--help' for additional options and output filtering

[--] Skipped version check for MySQLTuner script
[OK] Currently running supported MySQL version 10.0.28-MariaDB
[OK] Operating on 64-bit architecture

-------- Storage Engine Statistics ---------------------------------------------                                     --------------------
[--] Status: +ARCHIVE +Aria +BLACKHOLE +CSV +FEDERATED +InnoDB +MEMORY +MRG_MyIS                                     AM +MyISAM +PERFORMANCE_SCHEMA
[--] Data in MyISAM tables: 2M (Tables: 18)
[--] Data in InnoDB tables: 219M (Tables: 92)
[!!] Total fragmented tables: 3

-------- Security Recommendations ----------------------------------------------                                     --------------------
[OK] There are no anonymous accounts for any database users
[OK] All database users have passwords assigned
[--] There are 605 basic passwords in the list.

-------- CVE Security Recommendations ------------------------------------------                                     --------------------
[OK] NO SECURITY CVE FOUND FOR YOUR VERSION

-------- Performance Metrics ---------------------------------------------------                                     --------------------
[--] Up for: 14d 14h 51m 16s (5B q [3K qps], 9M conn, TX: 3604G, RX: 1193G)
[--] Reads / Writes: 99% / 1%
[--] Binary logging is disabled
[--] Physical Memory     : 15.5G
[--] Max MySQL memory    : 22.3G
[--] Other process memory: 3.5G
[--] Total buffers: 1.3G global + 130.7M per thread (165 max threads)
[--] P_S Max memory usage: 0B
[--] Galera GCache Max memory usage: 0B
[OK] Maximum reached memory usage: 3.2G (20.47% of installed RAM)
[!!] Maximum possible memory usage: 22.3G (143.66% of installed RAM)
[!!] Overall possible memory usage with other process exceeded memory
[OK] Slow queries: 0% (145/5B)
[OK] Highest usage of available connections: 9% (15/165)
[OK] Aborted connections: 0.00%  (288/9860426)
[OK] Query cache is disabled by default due to mutex contention on multiprocesso                                     r machines.
[OK] Sorts requiring temporary tables: 0% (3K temp sorts / 2B sorts)
[!!] Joins performed without indexes: 19981
[OK] Temporary tables created on disk: 2% (45M on disk / 2B total)
[OK] Table cache hit rate: 34% (361 open / 1K opened)
[OK] Open file limit used: 1% (119/10K)
[OK] Table locks acquired immediately: 99% (9B immediate / 9B locks)

-------- ThreadPool Metrics ----------------------------------------------------                                     --------------------
[--] ThreadPool stat is enabled.
[--] Thread Pool Size: 8 thread(s).
[--] Using default value is good enough for your version (10.0.28-MariaDB)

-------- Performance schema ----------------------------------------------------                                     --------------------
[--] Performance schema is disabled.

-------- MyISAM Metrics --------------------------------------------------------                                     --------------------
[!!] Key buffer used: 20.6% (13M used / 67M cache)
[OK] Key buffer size / total MyISAM indexes: 64.0M/1.6M
[OK] Read Key buffer hit rate: 100.0% (57B cached / 15K reads)
[!!] Write Key buffer hit rate: 11.8% (1M cached / 1M writes)

-------- AriaDB Metrics --------------------------------------------------------                                     --------------------
[--] AriaDB is enabled.
[OK] Aria pagecache size / total Aria indexes: 128.0M/1B
[OK] Aria pagecache hit rate: 99.6% (9B cached / 42M reads)

-------- InnoDB Metrics --------------------------------------------------------                                     --------------------
[--] InnoDB is enabled.
[OK] InnoDB buffer pool / data size: 1.0G/219.2M
[OK] InnoDB buffer pool instances: 1
[OK] InnoDB Used buffer: 98.44% (64511 used/ 65535 total)
[OK] InnoDB Read buffer efficiency: 100.00% (360962777118 hits/ 360962795580 tot                                     al)
[!!] InnoDB Write Log efficiency: 79.29% (21999853 hits/ 27747616 total)
[OK] InnoDB log waits: 0.00% (0 waits / 5747763 writes)

-------- TokuDB Metrics --------------------------------------------------------                                     --------------------
[--] TokuDB is disabled.

-------- Galera Metrics --------------------------------------------------------                                     --------------------
[--] Galera is disabled.

-------- Replication Metrics ---------------------------------------------------                                     --------------------
[--] Galera Synchronous replication: NO
[--] No replication slave(s) for this server.
[--] This is a standalone server.

-------- Recommendations -------------------------------------------------------                                     --------------------
General recommendations:
    Run OPTIMIZE TABLE to defragment tables for better performance
    Reduce your overall MySQL memory footprint for system stability
    Dedicated this server to your database for highest performance.
    Adjust your join queries to always utilize indexes
Variables to adjust:
  *** MySQL's maximum memory usage is dangerously high ***
  *** Add RAM before increasing MySQL buffer variables ***
    join_buffer_size (> 128.0M, or always use indexes with joins)

/etc/my.cnf file:

[mysqld]
performance-schema=0
max_connections=165
wait_timeout=14400
interactive_timeout=14400
query_cache_type=0
query_cache_limit=1M
query_cache_size=1M
join_buffer_size=128M
tmp_table_size=64M
max_heap_table_size=64M
thread_cache_size=4
table_open_cache=3000
max_allowed_packet=268435456
open_files_limit=10000
innodb_buffer_pool_size = 1024M
innodb_log_file_size = 256M
innodb_buffer_pool_instances=1
key_buffer_size = 64M
innodb_file_per_table
default-storage-engine=MyISAM

2 Answers2

1

Note that MySQL is not the big consumer of processor horsepower, here. If this is an 8 core machine (I can't tell) then MySQL is only using 21% CPU; if it's a 12 core, it's only 14%. PHP seems to be using much of the rest.

Your next steps should include profiling the database queries the application is generating, using the MySQL slow query log and log_queries_not_using_indexes to see if there are cases of missing indexes or other antipatterns... and of course performance analysis of the application code.


Don't change anything because mysqltuner tells you to. It looks cool but it can give very wrong advice. No, there's not currently a better choice that I am aware of.


@a_vlad suggested in comments that innodb_buffer_pool_size be increased from 1G to 8G.

That would have been appropriate advice, but your system doesn't have enough memory to do this safely. This change will almost certainly improve your performance... until the workload hits a major spike... at which time the application will likely need to increase its memory footprint, and this will be impossible, since memory claimed by the buffer pool will reduce the available memory for everything else. That's not to underestimate the importance of the buffer pool being as large as possible -- this is perhaps the single most important system variable for overall performance, and the larger the better until it's too large to be safe.

This highlights the crux of the problem you have: if the database were the only thing on this server, the advice to bump the buffer pool to 50% (or more) of system RAM would be perfect. As it stands, it isn't.

The most productive thing you can possibly do for both performance and stability, in all seriousness, is not run the application and MySQL together on the same machine.

They are serving the same workload, their resource demands will both tend to peak together, and a moment of bad behavior by either entity can start a death spiral.

Here's an oversimplified example:

Suppose your users table has a "last_login_date" that's updated when a user logs in. Something happens to cause a large number of row locks to be held in the users table.

So, when users try to log in, a php process obtains a db connection and tries to modify a row in the users table and end up on a lock wait condition. A process that normally takes e.g. 50 milliseconds now takes e.g. 50 seconds, which is a theoretical increase in your machine's workload (specifically, on this case, it's primarily a demand for memory-over-time) by a factor of 1000x, since each process could require 1000 times as much time as normal to service the request.

As more users try to log in, more web server processes are presumably spinning up to handle the traffic, and each of them establishes a database connection, tries to do that simple update, encounters a lock... and waits.

More processes? More memory.

Maybe you start swapping, which means everything slows down, including that long-running query that was the original cause of the mess, which prolongs the recovery time.

Or maybe Apache (?) and PHP consume so much memory that you end up with what appears to be a MySQL crash but is in fact the system killing off MySQL because of Apache's insatiable appetite for more memory to handle those additonal requests.

It's a potential death spiral when the two share one machine.

Two VMs on one physical machine would arguably be preferable, if the memory and processor allocations to each VM are not shared with the other.

MySQL is really not designed to limit itself. If you offer it more workload, it uses the necessary resources needed to do the work -- memory, CPU, disk, it will consume whatever is available, if it needs it, within the configured constraints... but these constraints, for the most part, only indirectly limit resources, such as the maximum number of allowed connections.

One significant difference when the application and database are separate is that the application can still slow itself down by overloading the system that's running it, but it will not tend to cause the database to also experience degraded performance due to demands on the system running the database.

Of course, it also simplifies scaling up the application tier with more servers and a load balancer if needed.

Michael - sqlbot
  • 22,715
  • 2
  • 49
  • 76
0

Ignore "fragmented tables", it is almost always bogus.

"143.66% of installed RAM" -- excessively conservative; not really something to worry about.

"Joins performed without indexes: 19981" -- may or may not be important

What is the value of table_open_cache? Of Uptime?

"Key buffer used: 20.6% (13M used / 67M cache)" -- wasting less than 1% of RAM; could decrease key_buffer_size.

"InnoDB buffer pool / data size: 1.0G/219.2M" -- plenty of headroom.

So.... The tunables do very little to explain "high CPU or load".

Set long_query_time = 1; turn on the slow log; run for a day; then use pt-query-digest to summarize the results. With that, show us the first couple of queries, together with SHOW CREATE TABLE and EXPLAIN SELECT.... From that we will probably recommend a composite index and/or some changes to the queries. That can lower the CPU.

In this snapshot, there were never more than 15 simultaneous user connections, not the 500 you mention.

For another look at the tunables, provide SHOW VARIABLES; and SHOW GLOBAL STATUS;. From those I can find more details than mysqltuner. (Probably need post.it or some other online way to present long output.)

Rick James
  • 80,479
  • 5
  • 52
  • 119