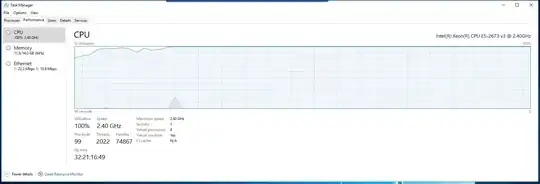
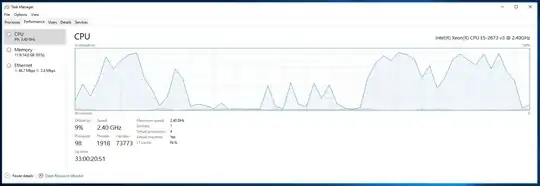
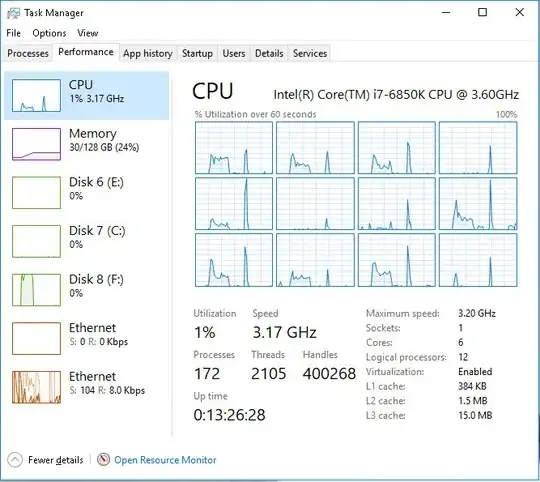
Monitoring CPU usage using task manager is not really a reliable source. There are many other(such as core OS activity,device drivers) non-sql processes running in the background that could be adding extra overhead without you even knowing.
PerfMon is the tool you should reach for in these cases.
Processor/%Privileged Time, Processor/ %User Time, Process (sqlservr.exe)/ %Processor Time
Will give you an idea of what is actually happening with your SQL server, without explaining each of these counters, turn on description checkbox and read from there, but it will essentially show you the ratio of SQL Server vs Other processes usage.
Even though its easy to spot, it is not so easy to diagnose.
There could be other "hidden" issues that are indicating that the processor is the problem. Such as having lot of compilations/recompilations, which are issues related to non-parametrized queries or forced recompilations. You can find these metrics in Perfmon: SQLServer:SQL Statistics/SQL Compilations/sec, SQLServer:SQL Statistics/SQL Re-Compilations/sec.
SQLServer:Plan Cache/Cache hit Ratio Indicates memory problem, but excessive page flushing in/out of memory also add extra CPU usage.
DMVs can also help you diagnosing the problem.
SELECT TOP ( 10 )
wait_type ,
waiting_tasks_count ,
( wait_time_ms - signal_wait_time_ms ) AS resource_wait_time ,
max_wait_time_ms ,
CASE waiting_tasks_count
WHEN 0 THEN 0
ELSE wait_time_ms / waiting_tasks_count
END AS avg_wait_time
FROM sys.dm_os_wait_stats
WHERE wait_type NOT LIKE '%SLEEP%'
AND wait_type NOT LIKE 'XE%'
AND wait_type NOT IN
( 'KSOURCE_WAKEUP', 'BROKER_TASK_STOP', 'FT_IFTS_SCHEDULER_IDLE_WAIT',
'SQLTRACE_BUFFER_FLUSH', 'CLR_AUTO_EVENT', 'BROKER_EVENTHANDLER',
'BAD_PAGE_PROCESS', 'BROKER_TRANSMITTER', 'CHECKPOINT_QUEUE',
'DBMIRROR_EVENTS_QUEUE', 'SQLTRACE_BUFFER_FLUSH', 'CLR_MANUAL_EVENT',
'ONDEMAND_TASK_QUEUE', 'REQUEST_FOR_DEADLOCK_SEARCH', 'LOGMGR_QUEUE',
'BROKER_RECEIVE_WAITFOR', 'PREEMPTIVE_OS_GETPROCADDRESS',
'PREEMPTIVE_OS_AUTHENTICATIONOPS', 'BROKER_TO_FLUSH' )
ORDER BY wait_time_ms DESC
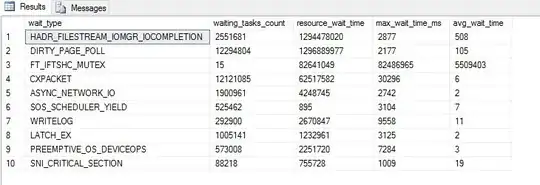
See if you can find SOS_SCHEDULER_YIELD & CXPACKET waits. If SOS_SCHEDULER_YIELD waits are high you might have some very CPU extensive queries, which you should pay attention to. This:
SELECT TOP ( 10 )
SUBSTRING(ST.text, ( QS.statement_start_offset / 2 ) + 1,
( ( CASE statement_end_offset
WHEN -1 THEN DATALENGTH(st.text)
ELSE QS.statement_end_offset
END - QS.statement_start_offset ) / 2 ) + 1)
AS statement_text ,
total_worker_time / 1000 AS total_worker_time_ms ,
( total_worker_time / 1000 ) / execution_count
AS avg_worker_time_ms ,
total_logical_reads ,
total_logical_reads / execution_count AS avg_logical_reads ,
total_elapsed_time / 1000 AS total_elapsed_time_ms ,
( total_elapsed_time / 1000 ) / execution_count
AS avg_elapsed_time_ms ,
qp.query_plan
FROM sys.dm_exec_query_stats qs
CROSS APPLY sys.dm_exec_sql_text(qs.sql_handle) st
CROSS APPLY sys.dm_exec_query_plan(qs.plan_handle) qp
ORDER BY total_worker_time DESC
will show you the most CPU extensive queries which you might want to optimize further.
Optimizing these queries you might find missing indexes, outdated statistics, Non sarg-able queries which are real issues that are behind high CPU usage.
Its not the only blueprint how to fix CPU problems but i hope it gives you a good start!


