If you capture queries when they finish with the SQL:BatchCompleted or SP:Completed trace running, aborting a query will show up as a finished query.
Lets say I run this query:
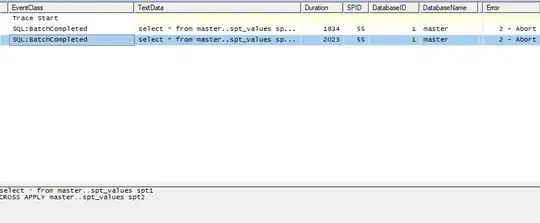
select * from master..spt_values spt1
CROSS APPLY master..spt_values spt2;
And kill it end it after 2 seconds of executing: 
It will still show up in my profiler trace. What will be different is the error column. On normal executions it will show as: 0 = OK. When aborting the query, it shows as: 2 - Abort
The same is true for aborting a procedure, it will show up in sp:completed.
Avoiding aborted queries as they time out is finding why they took over 30 seconds.
One of the things you should read through is Why is my query suddenly slower than it was yesterday?.
You can post a new question to seek advice on improving the query runtime.
We would need the actual execution plan, table definition, ... (generally as much information as possible). I am sure that we would be able to help you with the reporting query.
Another band-aid solution could be increasing the time the queries are allowed to run.
BTW: The canceled query used the same execution plan as the quick one.
It should not be the execution plan issue
It could be running with different parameters, resulting in parameter sniffing.
Adding OPTION(RECOMPILE) to the query could disable parameter sniffing if you are willing to live with the cost of recompiling the query on each execution.
Other reasons could be waiting for resources, such as being blocked, cpu / memory pressure, ....


