Moved from StackOverflow.
Scenario
I have a ASP.NET Core 5 (.NET 5) project that deals with GPS devices and generates roughly 6-8GB of data per day. For the past several months I've been working on improving the reading and writing of this data. For reading I've completely, I think, removed EF Core and replaced it with Dapper and stored procedures. For writing I'm still using EF Core and I've been optimizing the data types for the columns, recreating the indexes, and overall rebuilding the database (14K line upgrade script so far). I've managed to reduce the size by 71% from all of that and the growth should be substantially slower, maybe 0.5-1GB per day.
All of this is great, but there are some large accounts that have thousands of devices in them that generate thousands more notifications per day. I know that the indexes are as good as they're gonna get at this point and most of the hot queries are doing seeking about 95% of the time, but we're running into an issue that if we open say six of the largest accounts at once, about four of them will load almost immediately, and the other two will time out. Refreshing the two that failed always time out.
If I restart SQL Server, and reload the two that failed, they'll instantly load, but now two of the previous four will fail. It basically seems to be that whichever ones load first will always load, the remaining will fail. Obviously when restarting SQL Server the memory is flushed until it starts building up again. So it's some sort of a memory/caching issue. I've noticed that once the memory is filled up and it tries to read from disk, it's reading at about 20MB/s when the drive can do 2.5-3GB/s. I left one of the failing queries to run then stopped it after 10 min of waiting, restarted SQL Server, and retried it and it completed in one second.
The database is running on my dev computer which has a Core i7 4790K (4C8T) @4.4GHz, 32GB of RAM, and a 1TB 970 Pro, Windows 10 20H2 Pro. The live server is on AWS and has an EPYC 7571 4vC @2.2GHz, 16GB of RAM, and a 2TB, 6000 IOPs, 1000 MB/s gp3 volume (the size will be reduced to 512GB or 768GB once the database is rebuilt and shrunk), Windows Server 2019 1809. The database is SQL Server 2019 on both.
Question
What can I/should I do to resolve the time outs/regressions when the memory ends up filling up?
Replying to Comments (1)
A little bit more information about the live server. It is a t3a.xlarge on AWS and I'm entertaining the idea of bumping it to t3a.2xlarge depending on the costs. It reboots nightly. It's not a perfect configuration because I also have MySQL (disabled) on it so that we could import the original database from the previous developer into SQL Server. It needs to be rebuilt, that I know, but I don't have the time to do that right now or any time soon.
@AMtwo, I did have max memory at the default and I changed it to 28GB out of the 32GB on my system. LPIM was off so I turned it on.
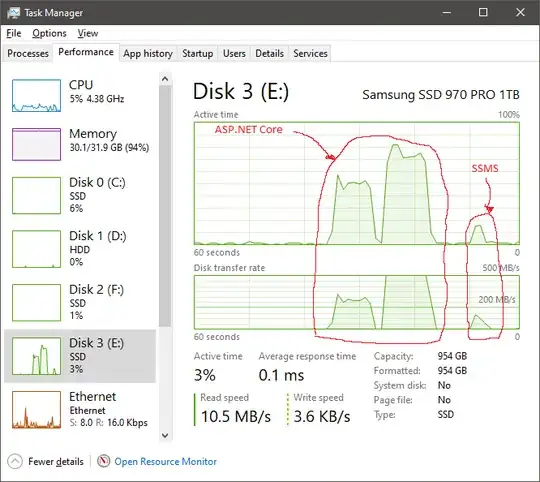
@J.D., For the four largest accounts the row counts are: A 5,507, B 1401, C 318, D 220. Curiously, after the latest rebuild overnight I went through and opened all accounts in the ASP.NET application of the type those are (about 211), and all of them opened except for A. A is the biggest account and is the one that is most accessed unfortunately. As of right now when accessing it from ASP.NET Core, it times out and does a large read spike, but when I run the exact same SP using SSMS it loads fine in about 2 seconds with a much smaller read spike.
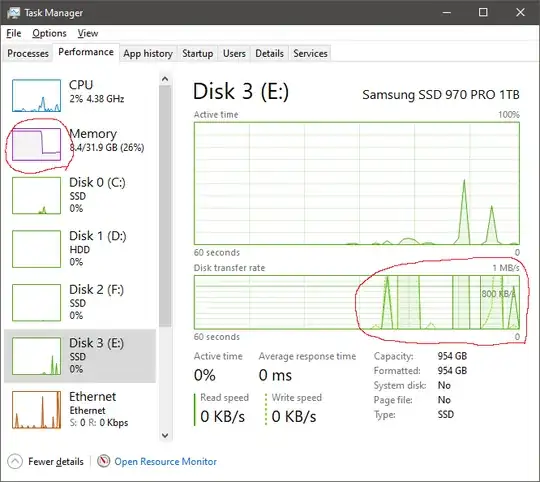
See the attached screenshots from task manager. After all other accounts were opened once and I try this large account in ASP.NET Core it just times out and does large 100MB+ reads for a long time, while in SSMS it does much smaller 100MB+ reads for a much shorter time and completes in 2 seconds. After restarting SQL Server, memory is dumped, and opening this account in ASP.NET Core results in a 2-3 second processing with barely 1MB in disk reads. Memory consumption also barely registers.
I'm shrinking the database because the live database is spiraling out of control and so are the associated costs. Currently between the main data database and the Serilog database we're using 929GB with a growth of 6-8GB per day. The rebuilt databases are now at 268GB with an expected growth of 0.5-1GB per day or less. So, to be blunt, I don't particularly care about the red flags you speak of about shrinking the database. I need to be able to manage and control the growth of the database, and the costs associated with it. I can't just keep bumping up the volume size or eventually changing the instance size and adding more expensive resources just to be able to run when a rebuild and shrink will do a much better job. For what it's worth, when I run the database rebuild script, the apps will also be getting updated and will be completely shut down and incoming data will be redirected to S3 and imported back when they come back online, there will be no reading or writing to the database from the apps at that time, so I can do the rebuild and shrink.
Eventually we'll have to implement archiving to start dumping old data out of the database to keep its size manageable, but that's work for far into the future.
The execution plan is attached. The only difference between all accounts is the id being passed into the SP.
@David Browne, I will look into that.
@RBarryYoung, Open or load I'm using interchangeably for when I browse the ASP.NET Core app and go to an account's page. I think the execution plan screenshot covers what you're looking for?
Before restarting SQL Server.
After restarting SQL Server.
Execution plan for the SP.


