4

I'm running Query Store to make a DB perform better. It's been working fine until now.. When i try to load the Top durations of last day it took me 26 min to load the screen.

The SQL version im running is: Microsoft SQL Server 2017 (RTM-CU27) (KB5006944) - 14.0.3421.10 (X64) Oct 14 2021 00:47:52 Copyright (C) 2017 Microsoft Corporation Standard Edition (64-bit) on Windows Server 2019 Datacenter 10.0 (Build 17763: ) (Hypervisor)

The query pops out in the QS:

/*
This query text was retrieved from showplan XML, and may be truncated.
*/

SELECT TOP (@results_row_count) p.query_id query_id, q.object_id object_id, ISNULL(OBJECT_NAME(q.object_id),'') object_name, qt.query_sql_text query_sql_text, ROUND(CONVERT(float, SUM(rs.avg_durationrs.count_executions))0.001,2) total_duration, SUM(rs.count_executions) count_executions, COUNT(distinct p.plan_id) num_plans FROM sys.query_store_runtime_stats rs JOIN sys.query_store_plan p ON p.plan_id = rs.plan_id JOIN sys.query_store_query q ON q.query_id = p.query_id JOIN sys.query_store_query_text qt ON q.query_text_id = qt.query_text_id WHERE NOT (rs.first_execution_time > @interval_end_time OR rs.last_execution_time < @interval_start_time) GROUP BY p.query_id, qt.query_sql_text, q.object_id HAVING COUNT(distinct p.plan_id) >= 1 ORDER BY total_duration DESC

The execution plan shows a 96% cost of a Clustered Index Scan on the object [plan_persist_runtime_stats].

The following execution plans are from different servers:

I didn't configure the Query Store via script, just via the properties. But below my setup:

ALTER DATABASE [<DATABASE>] SET QUERY_STORE (
    OPERATION_MODE              = READ_WRITE,                   
    CLEANUP_POLICY              = (STALE_QUERY_THRESHOLD_DAYS = 15), 
    DATA_FLUSH_INTERVAL_SECONDS = 900, 
    MAX_STORAGE_SIZE_MB         = 500,                             
    INTERVAL_LENGTH_MINUTES     = 60, 
    SIZE_BASED_CLEANUP_MODE     = AUTO,                             
    QUERY_CAPTURE_MODE          = AUTO,                             
    MAX_PLANS_PER_QUERY         = 200
    WAIT_STATS_CAPTURE_MODE     = OFF                                
    )

Questions

If it's a SQL Server bug, is there somewhere where I can find a list of versions that has this behaviour?

Does anyone know what the fix is?
John K. N.
  • 18,854
  • 14
  • 56
  • 117

4 Answers4

7

The core problem is that the T-SQL code that drives the SSMS GUI reports is not efficient. Unfortunately, Microsoft has a long history of including inefficient T-SQL in parts of SSMS. The problem is further compounded by the query store data model and the code that makes up the DMVs. There are unusual performance gotchas in many places. For example, join elimination may not work as expected with some query store DMVs.

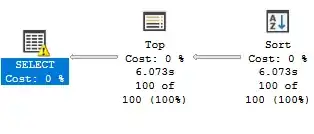
I'll back up my criticism by doing a minimal effort rewrite of the query text that you captured. As is, the original code took 6 seconds to execute against one of my production databases:

enter image description here

Note that the following rewrite only works against the database that I developed it against due to the hardcoded filter values for runtime_stats_interval_id:

DECLARE
@results_row_count INT = 100,
@interval_end_time datetimeoffset = '2021-12-08 03:00:00',
@interval_start_time datetimeoffset = '2021-12-07 03:00:00';

SELECT , qt.query_sql_text query_sql_text FROM ( SELECT TOP (@results_row_count) p.query_id query_id, q.object_id object_id, ISNULL(OBJECT_NAME(q.object_id),'') object_name, q.query_text_id, ROUND(CONVERT(float, SUM(rs.avg_durationrs.count_executions))*0.001,2) total_duration, SUM(rs.count_executions) count_executions, COUNT(distinct p.plan_id) num_plans FROM sys.query_store_runtime_stats rs JOIN sys.query_store_plan p ON p.plan_id = rs.plan_id JOIN sys.query_store_query q ON q.query_id = p.query_id
WHERE NOT (rs.first_execution_time > @interval_end_time OR rs.last_execution_time < @interval_start_time) AND rs.runtime_stats_interval_id BETWEEN 11534 and 11558 -- code omitted to do this mapping but it isn't hard GROUP BY p.query_id, q.query_text_id, q.object_id --HAVING COUNT(distinct p.plan_id) >= 1 ORDER BY total_duration DESC ) q1 INNER JOIN sys.query_store_query_text qt ON q1.query_text_id = qt.query_text_id;

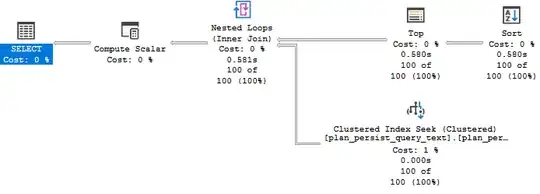
The new code returns the same results but finishes in about 600 milliseconds:

enter image description here

Of course, the above isn't terribly helpful to you. It's just a sign that there is a defect with SSMS that Microsoft could address with code changes on their end. I can think of the following options for resolving your problem:

  1. Give up on using some of the SSMS query store GUI reports and run custom T-SQL instead. Some members of the community have written code to do that and they make it freely available. Quickie Store is one such example.
  2. It is somewhat unlikely, but your performance issue may be caused by parameter sniffing. When you open the query store GUI it immediately runs a report over an hour date range. It may be that SQL Server cached a query plan for that one hour range that doesn't perform well for a 24 hour date range. I've seen this happen before on systems that were significantly busier at certain times of the day. You can test for a parameter sniffing problem by removing the query plan that you identified from the cache.
  3. There is an answer on this site that solves SSMS query store GUI performance issues by using plan guides.
  4. You could try opening a support ticket with Microsoft if you have a support contract with them. You could also try leaving feedback about slow performance on the community feedback forum.

On an unrelated note, I noticed in your question that you don't have wait stats collection enabled. I encourage you to enable that if it's possible to do so. I find it to be a powerful tool for troubleshooting why queries timed out. Unfortunately, it does break some of the GUI reports.

Joe Obbish
  • 32,976
  • 4
  • 74
  • 153
4

If your Query Store is configured a bit too large, then executing any query against the Query Store can be really slow.

Try reducing the size of your Query Store:

ALTER DATABASE [<DATABASE>] SET QUERY_STORE = ON;
GO
ALTER DATABASE [<DATABASE>] SET QUERY_STORE (
    OPERATION_MODE              = READ_WRITE,                       -- READ_WRITE, READ_ONLY
    CLEANUP_POLICY              = (STALE_QUERY_THRESHOLD_DAYS = 3), -- 30 (def)
    DATA_FLUSH_INTERVAL_SECONDS = 600, 
    MAX_STORAGE_SIZE_MB         = 1024,                             -- Size of the Query Store
    INTERVAL_LENGTH_MINUTES     = 60, 
    SIZE_BASED_CLEANUP_MODE     = AUTO,                             -- AUTO (DEF), OFF
    QUERY_CAPTURE_MODE          = AUTO,                             -- AUTO (DEF 2019), ALL (DEF 2017), NONE, CUSTOM
    MAX_PLANS_PER_QUERY         = 4
    WAIT_STATS_CAPTURE_MODE     = ON                                -- ON, OFF (as of 2017)
    -- QUERY_CAPTURE_POLICY         = STALE_CAPTURE_POLICY_THRESHOLD = 1 DAY, EXECUTION_COUNT = 30, TOTAL_COMPILE_TIME_MS = 8, TOTAL_EXECUTIOIN_TIME_MS = 4 -- (as of 2019)
)

We had an issue with a Query Store on a 650 GB sized database, where a Query Store size of 10240 MB would basically break the database. We were unable to query the QS and it would run full with thousands of SQL statements.

Reducing the size of the Query Store to below 6 GB was (in our case) the solution to the problem of being unable to query the Query Store.

Reference Reading

John K. N.
  • 18,854
  • 14
  • 56
  • 117
1

Updating statistics like the accepted answer suggests here, helped me with very slow and long Query Store: Never ending Query Store search

jitbit
  • 765
  • 1
  • 8
  • 15
0

Nuking the query actually solves the issue. With the code below I find all bottle necks, after that top duration is loaded in a second again.

--search

SELECT text, [qs].[last_execution_time], [qs].[execution_count], [qs].[total_logical_reads]/[qs].[execution_count] [AvgLogicalReads], [qs].[max_logical_reads], [qs].[plan_handle], [p].[query_plan] FROM sys.dm_exec_query_stats [qs] CROSS APPLY sys.dm_exec_sql_text([qs].sql_handle) [t] CROSS APPLY sys.dm_exec_query_plan([qs].[plan_handle]) [p] WHERE [t].text LIKE '%rs.first_execution_time > @interval_end_time%' order by last_execution_time desc GO

--NUKE SINGLE QUERY

DBCC FREEPROCCACHE (enter plan_hanle here)

mustaccio
  • 28,207
  • 24
  • 60
  • 76