I would appreciate help with a Filemaker question about creating an x-y plot.
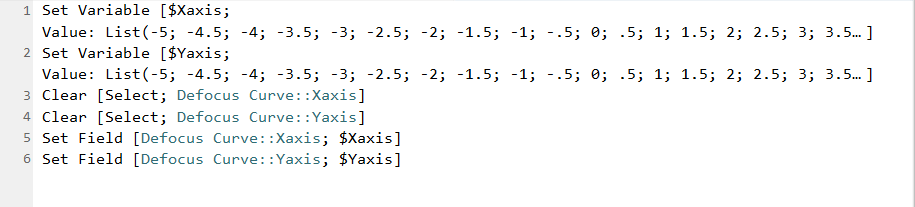
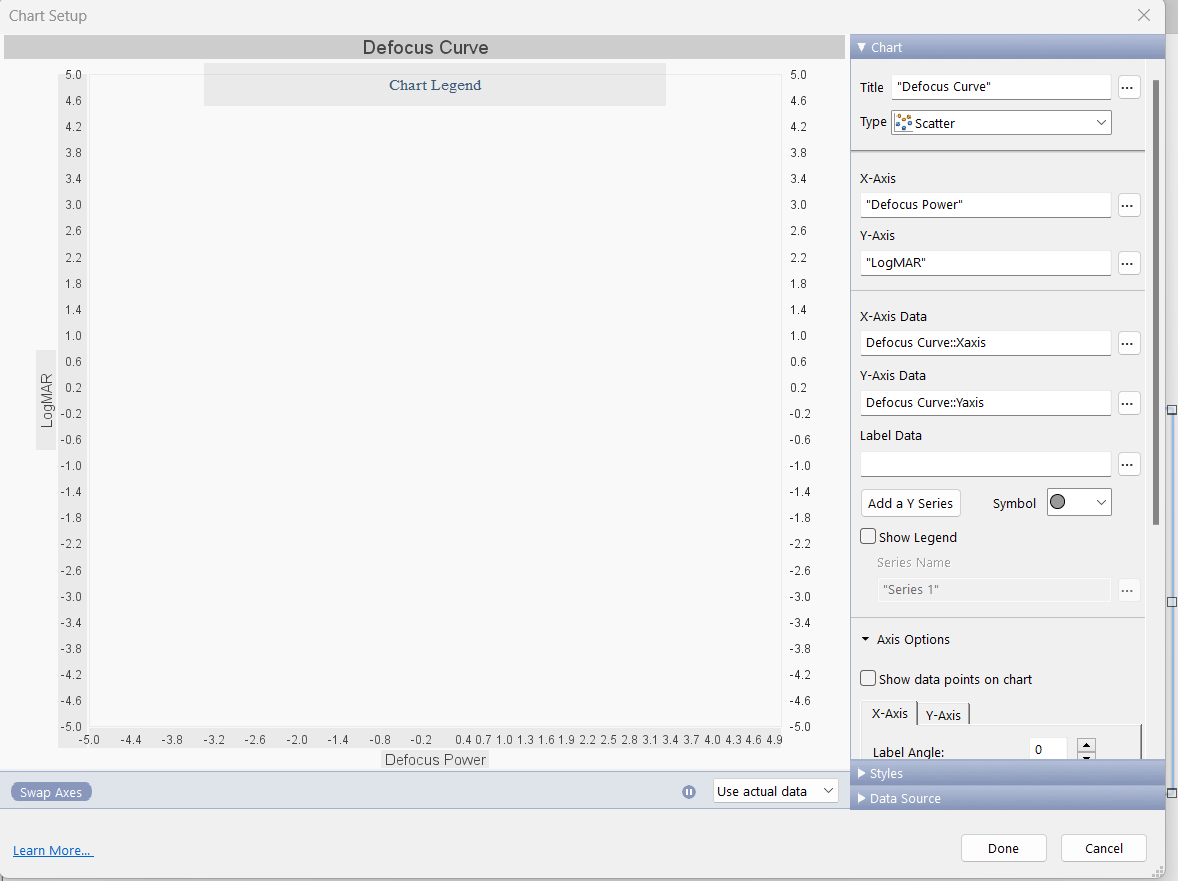
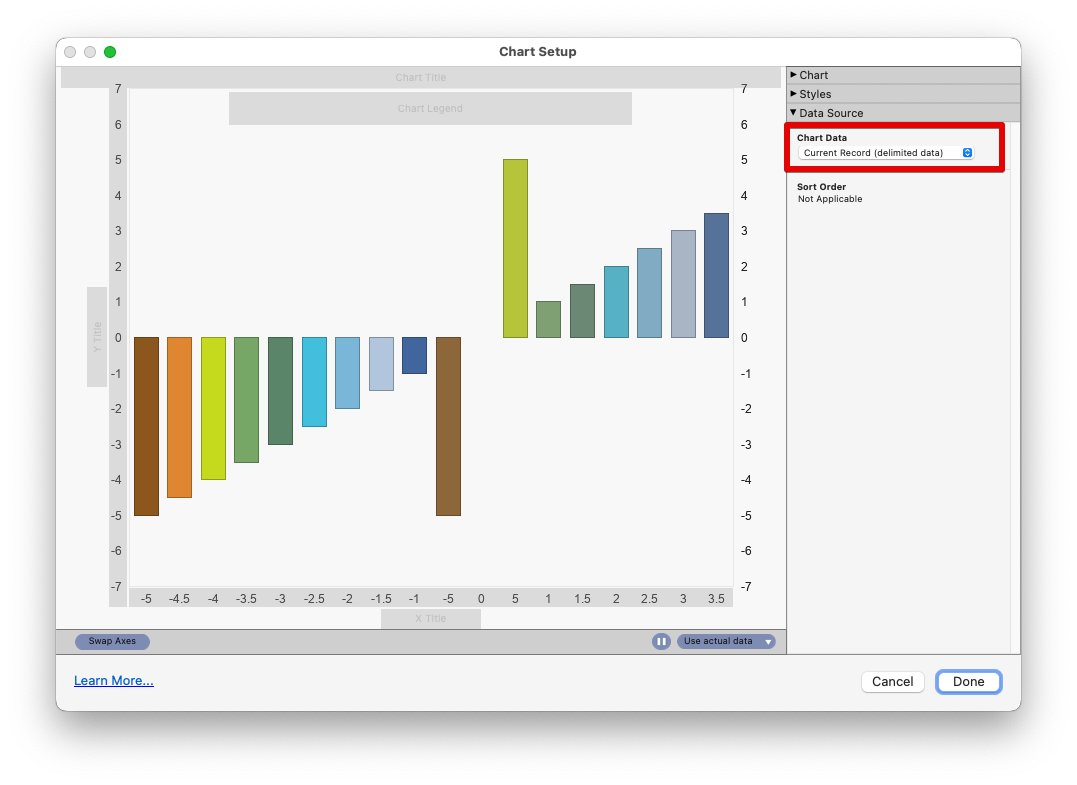
I have a list of numbers to plot for x and a list of numbers to plot for y. I read the numbers into separate variables and then read the values into separate fields. I ran the script below to load the variable. I then tried to plot with X-Axis data = Xaxis and Y-Axis data = Yaxis. Nothing gets plotted. Could I please have help how to correctly plot these numbers? Below is the script and the chart setting. For example, I would like to plot x=-5,y=-5, x=-4.5,y=-4.5, et. The plot should be linear. Thank you.