Brief problem statement
First thing first: after posting this question originally and working more with our DBAs, I actually learned that our DB runs in a container, instead of being installed natively. From what I've read before, it's discouraged to do that in prod, since databases do all sorts of microoptimizations with memory and storage and cpu, and the container might obscure some things and so the behavior will not be optimal. So, if after reading this question you think it can be actually caused by the DB running in a container, definitely lmk.
Alright so now to the actual question:
There will be a detailed explanation below, but this initial problem statement is just to give you a feel of what we’re dealing with here.
We have a feature called “Tasks”, which is just a generic task runner. A task is represented by a single row in an InnoDB table (using MariaDB 10.6.14); anyone can create a task, and then one of the workers will pick it up, run, potentially retry a few times if there are errors, and once the task is finished (successfully or not), delete the row from the table.
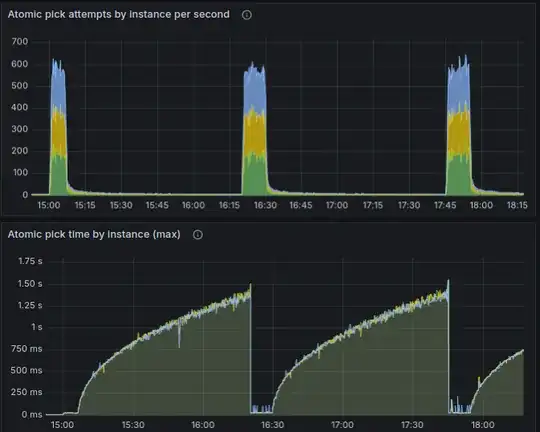
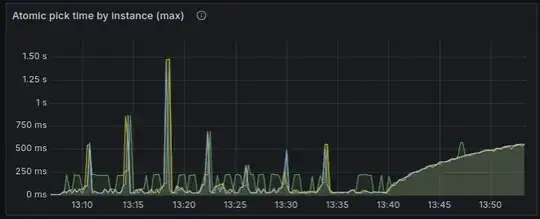
The issue is that, having plenty of tasks to run (even just 200K of runnable tasks which we need to run asap is enough), the performance alternates between those two modes:
- Performance is great (the query to pick the next task takes 20-30ms, and every worker is able to run about 200 tasks per second or more)
- Performance is terrible (the query quickly jumps to hundreds of milliseconds, and keeps slowly growing, and we’re running 1-3 tasks per second per worker).
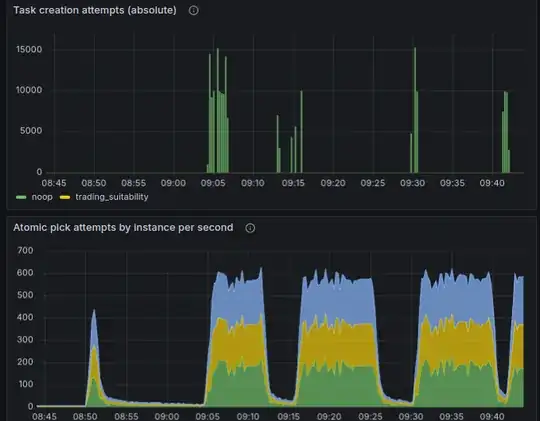
The “great” phase usually lasts for 5-10 mins, followed by a few hours of the “terrible” phase; then it fixes itself and goes back to “great”, etc.
Here’s how it looks on the charts:
A few quick points to highlight:
- On this chart, no new tasks are being inserted in the table; we already have a few hundred K of tasks in the table that we need to run ASAP, and as we run them (and
DELETEthe rows from the table), the performance alternates like that. - It doesn’t seem to have anything to do with the amount of data in the table: as mentioned, even just 200K of rows is enough, which is nothing for the modern hardware (and yeah the hardware specs used here are very good). It’s rather just the velocity of changes that seems to be causing this: those 200K of rows represent the tasks that we need to run ASAP, and we do. When we have a much lower rate of tasks that we delete/update, those performance issues don’t happen.
- It doesn’t seem to be caused by a wrong index: if there wasn’t a proper index, the performance would always be bad. But here it switches back and forth on its own, without us adding any new data to the table, so it seems to be some internal mariadb issues.
This was just to give you a feel of what the issue is like. I have more to say on this, but before I do that, I feel I need to share more implementation details, so let’s get to it.
Background info and implementation details
As mentioned above, we have a generic task runner. A task is represented by a single row in an InnoDB table; anyone can create a task, and then one of the workers will pick it up, take care of, and eventually delete the row from the table.
There are two additional features worth highlighting:
- A task can be scheduled either to run ASAP or after a specific time in the future; the only time-related guarantee here is that the task will not run before its scheduled time. We say that a task is runnable if we don’t need to wait more and can already run it whenever we can;
- Every task has a priority: from 0 (highest) to 4 (lowest); having multiple runnable tasks on different priorities, the higher-priority tasks will always be picked first.
Btw those features are a big part of why this was implemented on top of MariaDB, and not say Kafka or similar. It’s not a textbook use case of Kafka.
The usage pattern can be very bursty: most of the time we might have like 10-20 tasks per second being created and ran ASAP, and it doesn’t cause problems; but then as part of some batch job we might create a few millions of low-priority tasks, and the workers will run them at the rate of 500 tasks per second in total.
This is how the table looks like (there are a bit more fields, but they are not relevant to the problem, so are omitted)
CREATE TABLE `tasks` (
  `id` bigint(20) unsigned NOT NULL AUTO_INCREMENT,
-- Identifies which handler to actually run for this task. Think of it
  -- as the name of a function to call.
  name varchar(127) NOT NULL,
-- Priority of the task; the highest priority is 0, and as the number
  -- increases, priority lowers. Currently, it can be from 0 to 4.
  priority tinyint(3) unsigned NOT NULL DEFAULT 2,
-- Status of the task, one of those:
  -- - 0: PENDING: the task is ready to run asap or after next_attempt time.
  --      It can be the initial status that the task is created with, but the
  --      task could also reenter this status again later if it failed and the
  --      scheduler decided to retry it;
-- - 1: PROCESSING: the task is currently being executed;
-- Note: there are no states for completed or failed tasks, because such
  -- tasks are deleted from this table.
  status tinyint(3) unsigned NOT NULL DEFAULT 0,
-- Specifies the earliest time when the task needs to run next time.
  -- Used for tasks scheduled for the future, as well as for implementing
  -- retries with backoff. If NULL, the task should run ASAP.
  next_attempt timestamp(6) NULL,
PRIMARY KEY (id),
-- See details on this particular index ordering below.
  INDEX tasks_next_attempt_id_idx (priority, next_attempt, id)
) ENGINE=InnoDB AUTO_INCREMENT=1 DEFAULT CHARSET=utf8;
There are a few workers (not too many: something like 3 or 6 etc) polling this table (see the exact query below); when a worker gets no task to run, it backs off and polls it only once per second, but when it successfully gets a task to run, it tries to get the next one right away, so that having many runnable tasks, we run them as fast as we can.
The query to pick the next task does the following, atomically:
- Find the id of the next task to run (taking into account the scheduled time and priorities as described above)
- Set its status to 1 (which means “processing”)
- Set the
next_attemptto the current time plus 15 seconds (which is an interval after which the task will rerun if it appears dead; it’s not really relevant to the problem, but for the context: while the task is running, every 10 seconds its next_attempt will be again updated to 15 seconds into the future, so as long as the worker is functioning and the task keeps running,next_attemptwill always be in the future) - Return the task id
Here’s the exact query (where 2024-04-11 08:00:00 used as the current time: we actually pass specific timestamps like that instead of using NOW() for better testability, but it’s not related to the issue).
UPDATE tasks
INNER JOIN (
    SELECT id FROM tasks
    WHERE
            priority IN (0, 1, 2, 3, 4)
        AND (next_attempt IS NULL OR next_attempt <= '2024-04-11 08:00:00')
    ORDER BY priority, next_attempt, id
    LIMIT 1
    FOR UPDATE SKIP LOCKED
) tmp ON tasks.id = tmp.id
SET
    tasks.status=1,
    tasks.next_attempt='2024-04-11 08:00:15',
    tasks.id=LAST_INSERT_ID(tasks.id)
As you see, there are 3 parts in this query:
- The outer
UPDATE - The
INNER JOIN - The
SELECTsubquery.
In case you’re wondering if those subqueries with joins are causing issues, let me also mention upfront that, when we’re in the “terrible” performance phase and I just execute the SELECT query, without any joins or updates, it is also very very slow. So it doesn’t seem like those updates or joins are the culprit; the SELECT itself, albeit pretty simple, is the problem.
Let’s now look at every part in more detail.
The SELECT subquery
So here’s the query:
SELECT id FROM tasks
WHERE
        priority IN (0, 1, 2, 3, 4)
    AND (next_attempt IS NULL OR next_attempt <= '2024-04-11 08:00:00')
ORDER BY priority, next_attempt, id
LIMIT 1
FOR UPDATE SKIP LOCKED
This section is super verbose; if you feel that the query is descriptive enough and it makes sense, feel free to skip this whole section.
As briefly mentioned above, when we’re in the “terrible” performance phase, it’s this very part that is slow: I execute it manually, and even on an empty table it might take more than 3 seconds to complete.
It selects a single task of all the runnable tasks. One very important thing is to make sure that mysql doesn't have to check rows one by one, trying to find a row which finally matches the WHERE clause: our tests have confirmed that having even just 15K of non-runnable tasks in front of runnable ones slows down the query from milliseconds to hundreds of milliseconds, so this is crucial. To this end, we do a number of things:
- The
ORDER BYclause tries to put runnable tasks before non-runnable ones, so that ideally the very first row that mysql checks already matches theWHEREclause; - Obviously, there is an index supporting this
ORDER BY; - The
WHEREclause corresponds to theORDER BYin such a way so that when mysql does encounter a non-matching row, it knows that a whole bunch of the upcoming rows will not match either, and quickly skips that whole bunch.
Now let's go over more details, elaborating on this.
Let's imagine for a moment that we don't have task priorities, so all tasks are equal. Then, all we need to do about the ordering is just this:
ORDER BY next_attempt
And that's it. If next_attempt is NULL, it just means "this task should run ASAP", while a non-NULL value means "this task should run after this timestamp", and we set this timestamp for a number of different reasons: either a task was initially scheduled to run at certain time, or the task is being processed and the framework set it to the time when we'll consider a task being stuck so we should pick it again, or the task has failed and we're waiting for the backoff period before running it again: in all those cases we set next_attempt to some timestamp, and so ordering by it would put all runnable tasks before non-runnable ones (to mention explicitly, mariadb puts NULL values before non-NULL ones, which is what we want too).
The threshold between runnable and non-runnable tasks is just the current time, and so the WHERE clause can look like this:
WHERE next_attempt IS NULL OR next_attempt <= NOW()
Remember what we've said about the WHERE clause corresponding to the ORDER BY, so that mysql knows when to cut short. Imagine that we have 10 million rows in this table, and they all have next_attempt in the future. No tasks are runnable here, and when mysql sees the first row which doesn't match the WHERE, knowing that the rows are ordered by next_attempt, it concludes that no other rows can possibly match, and immediately bails out.
So far so good: our ordering always puts runnable tasks first, and mysql has enough info to bail out when we encounter the first non-runnable task.
Now, let's consider what happens when we introduce priorities. A higher-priority runnable task should always run before lower-priority task, so we should update our ordering to this:
ORDER BY priority, next_attempt
The problem here though is that this ordering no more guarantees that all runnable tasks come before non-runnable ones: there could be a high-priority task scheduled for the future, and a lower-priority task that should run asap, and in this case, we obviously need to run the lower-priority task first, but this ordering puts the high-priority non-runnable task first instead.
Bad news is that if we simply modify the ORDER BY clause as shown above, and leave the WHERE clause intact, then mysql is not smart enough to handle it correctly, and having even just 15K of high-priority tasks scheduled for the future, the picking becomes very slow, since mysql checks all of those non-runnable high-priority tasks one by one.
Good news though is that we can help mysql out, by adding one more condition to WHERE: priority IN (0, 1, 2, 3, 4). And yes, for this to work, we need to explicitly enumerate all the possible values for the priority, e.g. a seemingly equivalent (priority >= 0 AND priority <= 4) would not help. We need the exact values (I don't know if mysql devs have a good reason for this limitation). All in all, our WHERE clause becomes this:
WHERE
        priority IN (0, 1, 2, 3, 4)
    AND (next_attempt IS NULL OR next_attempt <= NOW())
With this, mysql is smart enough to figure that when it encounters a row on priority 0 and next_attempt in the future, it needs to skip all other rows with priority 0.
As another point, unrelated to the performance of the pick query, we want to make sure that if we have more tasks than we can run in parallel, and some of them are failing, then the tasks should be being picked in the round-robin fashion: this way, it won't be possible for a bunch of tasks that keep failing forever to saturate the system by not allowing other tasks to run. Luckily, we don't have to do anything special here: it's also solved by ordering by next_attempt (that's because whenever a task fails, its next_attempt is set to a timestamp in the future due to backoff), but I'm mentioning it just in case we have to rewrite the query somehow, because it's an important point to keep in mind.
And a couple final things here:
- We also use
FOR UPDATE SKIP LOCKED. This is very important for queue-like applications (like this one); it instructs mariadb to just ignore the rows which are already locked by another transaction, and go to the next row, instead of waiting for the existing transaction to finish. Having multiple workers querying the same data to run queued tasks, this is exactly what we want, and it helps with the performance very significantly. - For testability, instead of actually using the
NOW(), we pass the current timestamp manually from the app code: our tests use mocked time and pass mocked timestamps as the current time; - Also for testability, we additionally order by id. So the full order is
priority, next_attempt, id;
You might have noticed that the status column is not used for querying at all. It is kinda used in some other places but is just a sanity check; so technically we can drop this column. But it’s not related to the performance issues anyway.
The INNER JOIN
The subquery discussed above is wrapped in an INNER JOIN (...) tmp. This is in order to bypass a limitation of our MariaDB version (10.6) where subqueries cannot be used in IN clauses. That SELECT creates a temporary table of one entry, which makes MariaDB happy.
The outer UPDATE
The outer query updates the status to 1 (which means “processing”), the next_attempt column to the current timeplus the heartbeat expiration interval (15s), and does the id=LAST_INSERT_ID(id). This last thing is a no-op, but it instructs the LAST_INSERT_ID to memorize the value of id so we can get that id back.
Back to the problem
Ok so having that laid out, we have enough info to dive deeper into the problem we’re having: when the tasks are being deleted from the table too fast (e.g. 600 per second in total among all workers), the performance is great for a few minutes, then it abruptly becomes much worse, and then it slowly keeps getting worse for one or more hours; after which it recovers on its own, and so it keeps cycling back and forth this way. To repost the same chart again:
A few more observations:
1. When in the degraded state, the table can be empty while queries can take seconds
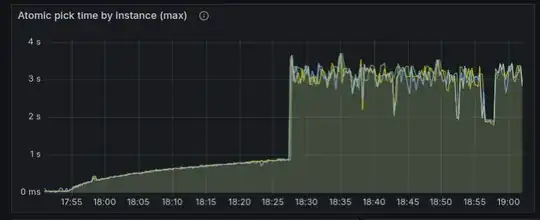
It happened already that the workers handled all the tasks, and the queries to get the next task were taking more than 3 seconds on an empty table. Here’s the chart illustrating that:
That jump from 1s to 3s is when there were no more tasks to run. I tried to execute just the SELECT part manually, and it took 3.67 seconds, on an empty table:
mysql> select count(*) from tasks;
+----------+
| count(*) |
+----------+
|        0 |
+----------+
1 row in set (0.3 sec)
mysql> SELECT id FROM tasks WHERE priority IN (0, 1, 2, 3, 4) AND (next_attempt IS NULL OR next_attempt <= NOW()) ORDER BY priority, next_attempt, id LIMIT 1 FOR UPDATE SKIP LOCKED;
Empty set (3.67 sec)
The EXPLAIN looks fine, exactly how it looks when everything works properly:
mysql> EXPLAIN SELECT id FROM tasks WHERE priority IN (0, 1, 2, 3, 4) AND (next_attempt IS NULL OR next_attempt <= NOW()) ORDER BY priority, next_attempt, id LIMIT 1 FOR UPDATE SKIP LOCKED;
+------+-------------+----------+-------+---------------------------------------+---------------------------------------+---------+------+--------+--------------------------+
| id   | select_type | table    | type  | possible_keys                         | key                                   | key_len | ref  | rows   | Extra                    |
+------+-------------+----------+-------+---------------------------------------+---------------------------------------+---------+------+--------+--------------------------+
|    1 | SIMPLE      | tasks    | range | tasks_priority_next_attempt_id_idx    | tasks_priority_next_attempt_id_idx    | 9       | NULL | 748746 | Using where; Using index |
+------+-------------+----------+-------+---------------------------------------+---------------------------------------+---------+------+--------+--------------------------+
1 row in set (0.26 sec)
I also tried to SHOW TABLE STATUS, the important bits from there are:
Data_length:    45 092 864
Index_length:    7 393 280
Data_free:     827 326 464
After a few hours of being in that degraded state, it recovered on its own (without having any data being inserted), and those stats became:
Data_length:        4 096
Index_length:       4 096
Data_free:    879 755 264
I’m not a DBA and not sure what exactly these numbers mean though, but thought it’s worth sharing them here. I’m guessing it tells me that the index is full of garbage (7 MB of index on an empty table can’t have anything but garbage), and it must also be telling me that the index is not getting rebuilt when it should have.
2. If we don’t DELETE the tasks, but only UPDATE them to make them non-runnable, it doesn’t help with the performance
I was just suspecting that the fragmentation (which is supposedly caused by deleting a lot of data from the table) might have something to do with it, so I just changed the logic to UPDATE the task after completion (set it to lowest the priority 5 which is never runnable) instead of DELETEing the row. It didn’t change anything about the performance; the patterns remained the same.
3. Doing a bunch of INSERTs helps
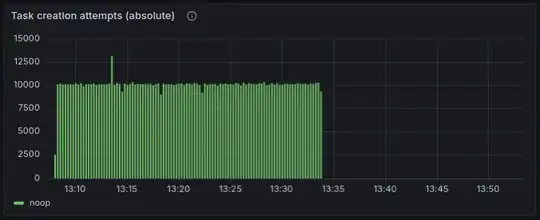
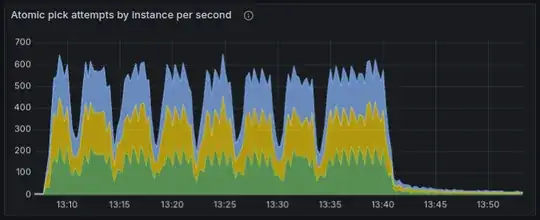
As another observation, when we not only run tasks (and therefore DELETE them from the table), but also INSERT new tasks at about the same rate, then even though mariadb still switches to poor performance periodically, it recovers very quickly. Check it out:
- So while we’re inserting tasks, it doesn't go into the degraded state for too long;
- Instead, there is a distinctive pattern: seemingly every 4 mins, the performance drops, and then immediately recovers.
- When we stopped creating tasks, it worked for a few minutes, and again fell into a degraded state for an extended period of time.
I also confirmed that by just waiting for it to degrade, and then inserting a bunch of tasks, to check if it’d help it to recover. It helped every time. Empirically found that inserting 10K or 20K is not enough, but 30K of tasks is usually enough; the performance recovers right after inserting enough tasks:
I guess it tells me that frequent INSERTs cause MariaDB to do something useful with the index, while frequent DELETEs and UPDATEs unfortunately do not.
4. Rebuilding an index helps
If we just build a new index and drop the old one:
ALTER TABLE tasks ADD INDEX tasks_next_attempt_id_idx2 (`priority`,`next_attempt`,`id`), ALGORITHM=INPLACE, LOCK=NONE;
ALTER TABLE tasks DROP INDEX tasks_next_attempt_id_idx;
It fixes the issue immediately, and doesn’t lock the table while building an index. Actually this is the most viable workaround we’re thinking of, at the moment: if we can’t find a way to make it happen automatically, we can just add some app logic like “if the next-task queries become slower than 100ms and stay this way for 5 seconds, recreate the index manually”; or even the lazy way like “rebuild the index every few minutes”. It sucks, and is generally a weird design to do ALTER TABLE in the app code, but practically it’s still much better than letting it be in the degraded state for hours.
Question
I’d appreciate any thoughts and feedback you have based on the explanation above, but the questions I'm actually asking are:
1. What is happening?
Really curious to learn some MariaDB implementation details which would explain this behavior, since it doesn’t make sense to me and I wasn’t able to find it on my own.
2. How to make it work fast without having to rebuild the index manually?
As mentioned before, doing a bunch of INSERTs, like 30K or more, usually helps it to recover from the degraded state, so it looks like MariaDB does some maintenance to the index behind the scenes, and this maintenance doesn’t happen for DELETEs or UPDATEs. I wonder if there is some knob in MariaDB that we can tune to enable some more aggressive index maintenance, without having to rebuild it manually.
