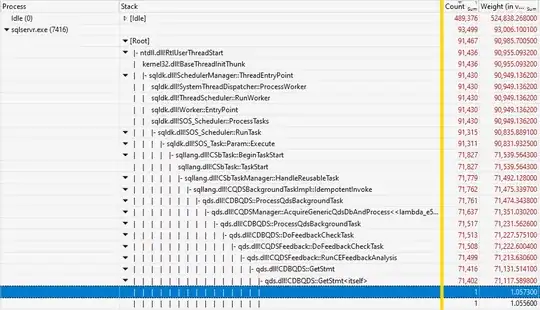
We have SQL Server 2022 Enterprise (16.0.4131.2) on Windows 2022 VM (8 vCPU cores) and there is an issue with the Query Store on one of the databases.
Below is the sequence of steps I can proceed to reproduce the issue on one specific database and observations I have made around it:
1 - The server is in an idle state with just a minor user generated load and negligible CPU utilization as a starting point.
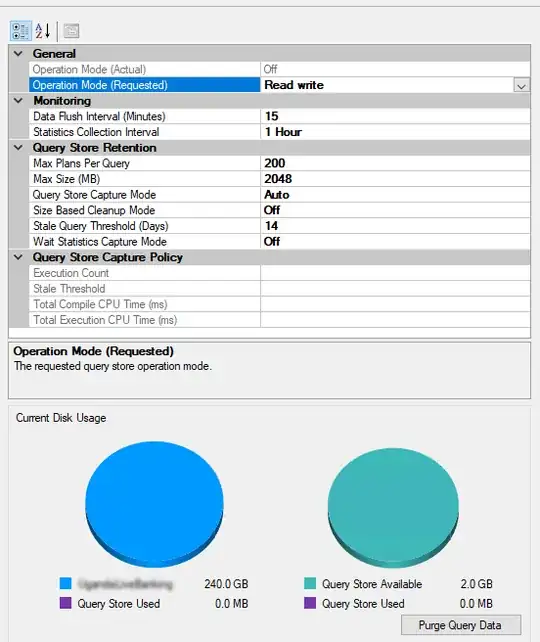
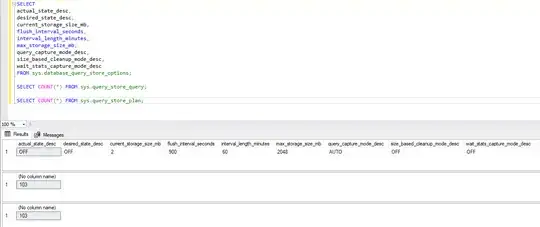
2 - The Query Store is turned off and empty for the problematic database as shown from the query below.
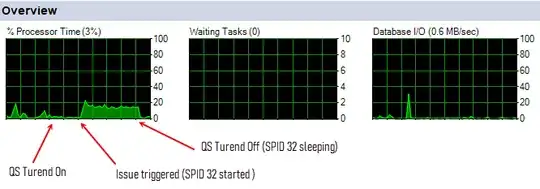
3 - When I switch the Query Store to the READ_WRITE mode, everything is perfectly fine for about 10 - 15 minutes. However, after this period of time the CPU utilization of the server suddenly rises to 15-20% See the Activity Monitor screenshot below.
The wait statistics shows a high increase in SOS_SCHEDULLER_YELD and PREEMPTIVE_OS_QUERYREGISTRY waits - they jump into the top server wait types in that time period.
The CPU utilization generated seems to be generated by an internal background process (SPID < 51) related with a Service Broker activity over the problematic user database. The Service Broker feature is not turned on in the database itself.
4 - The high CPU utilization, the above stated waits and the above mentioned SPID activity are continuously presented until the Query Store on the database is turned off.
There are no signs of any potential "self-recovery", if I keep the Query Store on. Once turned off, the CPU utilization goes down, waits disappear and the SPID stops generating the load and become "sleeping". Switching the Query Store into the READ_ONLY mode does not help. The Query Store must be turned off to get rid off the issue.
There is not any significant amount of data in the Query Store when the issue triggers - see below (queries taken after the QS was turned off).
Other related observations
If I turn on (READ_WRITE) the Query Store and keep it running just a while but not long enough to trigger the issue, then switch it to READ_ONLY the issue is not triggered in the 10-15 minutes time period as described above. However, then it is triggered almost instantly if I switch the Query Store to READ_WRITE any time later.
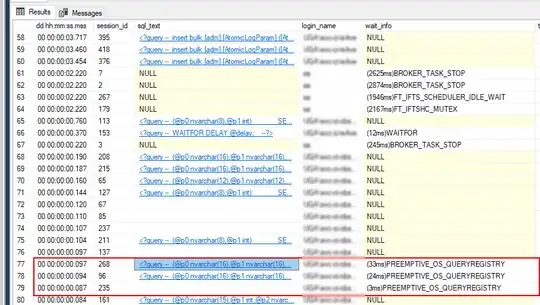
When the user load increases at the time when the issue is triggered, it can be seen that use queries over the database that takes a few milliseconds to process under the standard conditions starts to slow down and shows also not negligible PREEMPTIVE_OS_QUERYREGISTRY waits (as per sp_WhoIsActive shown below). These queries definitely makes no queries to the Windows registry.
We have the same database (meaning same structure) on several other SQL Server instances with the same load pattern (and even much bigger data and query volumes there) and the Query Store works perfectly fine there. It seems that something is broken in the Query Store just for this specific database.
It can be important, that the Query Store for that database was originally full and "size based cleanup process" triggered and SQL Server (likely) restarted during that time. I am suspicious that there is something broken in the QS in that database in relation to that ... I have tried also the sys.sp_query_store_consistency_check procedure, but without success.
Once the issue is triggered and "suspended" by turning the QS off, then when the QS is turned on again (without prior cleanup), it seems the issue is triggered again almost instantly.
The Query Store is completely unusable for the database under such conditions. Any ideas of how to fix this?
UPDATE 2024-08-01
Based on hint from Paul White's comment, I have made some experiments with the CE_FEEDBACK database scoped option and it seems to be the true trigger. The behavior is as described below:
I have the uncleared Query Store from previous attempts (just a few hundreds of catch queries) as the starting point.
- When I set CE_FEEDBACK = OFF and turn the QS to READ_WRITE the issue does not trigger.
- When I set CE_FEEDBACK = ON and turn the QS to READ_WRITE the issue triggers almost instantly.
- When I set CE_FEEDBACK = OFF and turn the QS to READ_WRITE the issue does not trigger. Then (with the running QS) I switch the CE_FEEDBACK = ON. The issue again triggers instantly. The interesting also is that when I set the CE_FEEDBACK = OFF again, it is not enough to stop the issue. The QS must be turned off to stop it as well.
WORKLOAD TYPE
As the issue seems to be related also with the workload type, I will try to describe it here, as the pattern is quite straightforward. It is almost 99% ad-hoc with the following query patterns:
- About 85% of the queries executed during the experiment is a simple join to table variable. The number rows passed to the variable varies from +/- 10 to +/- 500. The Source DB table vary between queries but the execution plan pattern is same as shown below.
- The rest of the workload are queries that follows the pattern as below. The problem with this portion is that due to a high variability of the parameters (the number of parameters often changes), then is is capable to fill a 2GB query store in a few days with "unique" queries, but it is not the case for the current scenario
I can imagine, that likely the first portion of the workload could be the problematic one for the CE_FEEDBACK.


