0

On sql server 2019, I occasionally get "Physical Memory pressure" alert. When I check the memory usage, I get two different cases.

  1. There is a large memory in free pages. Can anyone explain why the total used memory goes above 95% (generating the alert), when a lot of free pages are available? Can there be other explanation of why the size of memory in active pages is not restored to its previous level, other than there’s reduced workload?

  2. there is a very small memory in free pages (another server).

case 1 many free pages

case 2 few free pages

Tuyen Nguyen
  • 343
  • 10
benik9
  • 351
  • 2
  • 8

3 Answers3

1

The buffer cache is a dedicated area in RAM to store data and index pages to prevent reading tables directly from disk. I believe the monitoring tool considers anything in the buffer cache to be USED memory, which includes both active and free pages.

According to Microsoft:

A page remains in the buffer cache until the buffer manager needs the buffer area to read in more data. Data is written back to disk only if it's modified. Data in the buffer cache can be modified multiple times before being written back to disk.

So, the buffer manager will cache data as long as possible and as much as possible until memory is needed for new stuff and there is no free space available.

--

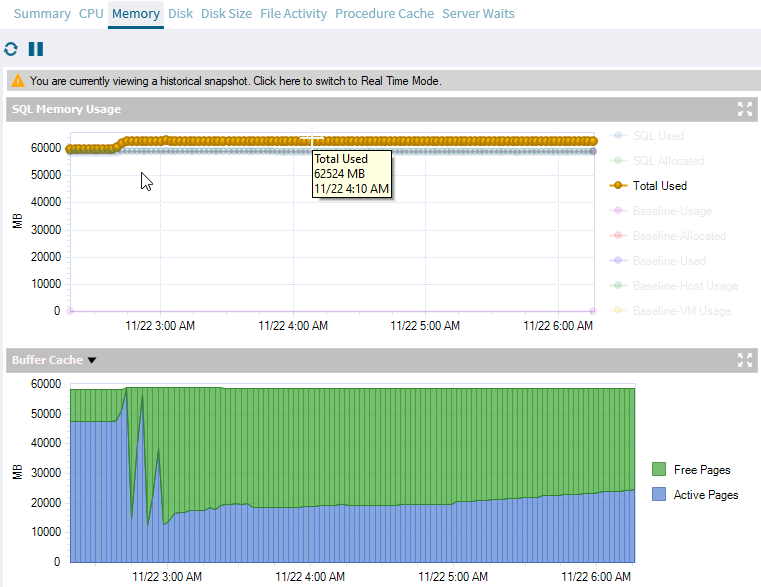
As I noticed, the number of active pages spiked, with a few ups and downs until it stabilized at low values with gradual increase overtime.

  • The number of active pages was at high points due to memory pressure caused by some queries.

  • That caused the buffer manager to flush pages from the buffer cache back to disk, creating free pages.

  • A high number of free pages doesn't indicate if the memory usage is efficient but often associated with high memory pressure.

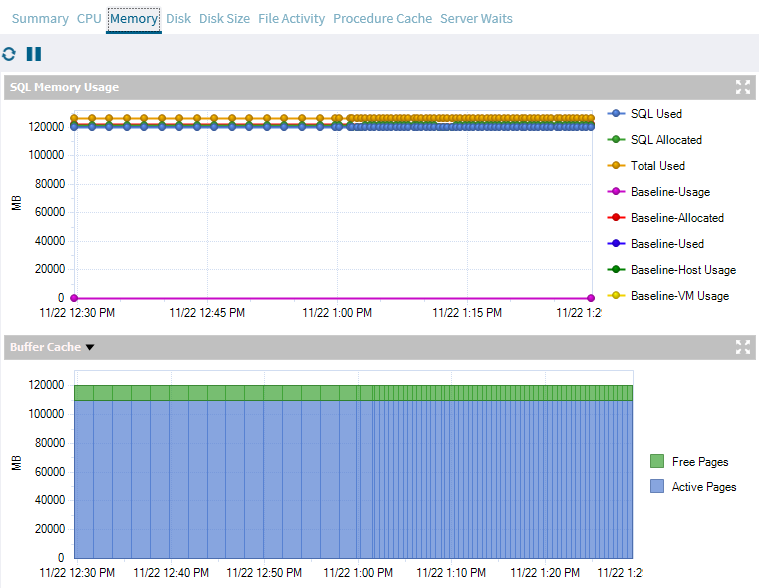
  • Subsequent workloads would cause SQL Server to load data from disk back into memory. Over time, the number of active pages slowly increased as the buffer filled the free pages with newly accessed data. If you give it enough time (depends on your workload), the buffer will fill up all the free pages with active pages eventually.

You may consider looking at the following charts to troubleshoot the issue:

  • Page Life Expectancy chart: Provides the time in seconds that a page remains in the cache or buffer pool. A significant drop indicates memory pressure. I often use this metric to identify when the issue started happening and checked resource-intensive queries running around that time.

  • Memory Area chart: Provides detailed insights into memory usage by components like Procedure Cache, Connections, Locks, Database, Optimizer, Sort, Hash, and Index.

  • Cache Hit Ratios: Displays the hit ratios of the Buffer and Procedure cache.

Also, queries with large memory grant can cause memory issue, you can check for those queries with high memory consumptions using Query Store or sp_BlitzCache from Brent Ozar - blitz.

Tuyen Nguyen
  • 343
  • 10
1

SQL Server loves memory! Unlike other database systems like PostgreSQL which depends on system cache SQL server do not depends on system cache. If you have a system with 1TB of memory and if you leave SQL server with an unlimited setting sooner or later it going to take all that memory and once it took there is no going back unless you restart the service.

Hence wise thing to do is limit the memory usage of SQL server to 75-80 % of your total system memory if it's a dedicated SQL Server VM.By doing this we save whole system from memory pressure and plenty of alerts piling up.

But how do we know we have sufficient memory for smooth database operations?

Best thing to check is cache hit ratio. An optimal system expected to have >95% cache hit rate. Anything <95% I would say it's suboptimal and you having problem with high physical disk read which is the most undesired in database world. If it <95% consider adding indexes and tuning I/O intensive queries or last resort upgrade!

UPDATE

You seeing free pages is because previously it was in use and it got evicted based on how frequently and how recently they are used- cost based eviction. Now it's no longer active either because whatever already in buffer satisfying all your query workloads- in other words 100% buffer cache hit rate or there is no activity at all. These free pages may or may not be used in future based on query pattern. But OS will never able to use it unless you release in some way.

goodfella
  • 589
  • 4
  • 14
1

I´d also look into the min server memory setting. If it is too high, it might lead to the scenario that you described, with a lot of free pages. I´d suggest setting the max server memory to 80-85% percent of the available memory, if it is a dedicated SQL box, and setting the min server memory to 50-60% of the available memory. Hope it helps.