I found this query by watching a test site with sql profiler for anything taking over 10 seconds. I plopped the code right out of sql profiler and into sql studio, where it was able to execute quickly. The slow "first run" behavior can be reset by using DBCC DROPCLEANBUFFERS.
Here's the slow query:
exec sp_executesql N'SELECT [t0].*
FROM [dbo].[MyTable] AS [t0]
WHERE [t0].[ParentID] IN (@p0, @p1, @p2, @p3, @p4, @p5, @p6, @p7, @p8, @p9, @p10, @p11, @p12, @p13, @p14, @p15, @p16, @p17, @p18, @p19, @p20, @p21, @p22, @p23, @p24, @p25, @p26, @p27, @p28, @p29, @p30, @p31, @p32, @p33, @p34, @p35, @p36, @p37, @p38, @p39, @p40, @p41, @p42, @p43, @p44, @p45, @p46, @p47, @p48, @p49, @p50, @p51, @p52, @p53, @p54, @p55, @p56, @p57, @p58, @p59, @p60, @p61, @p62, @p63, @p64, @p65, @p66, @p67, @p68, @p69, @p70, @p71, @p72, @p73, @p74)',N'@p0 int,@p1 int,@p2 int,@p3 int,@p4 int,@p5 int,@p6 int,@p7 int,@p8 int,@p9 int,@p10 int,@p11 int,@p12 int,@p13 int,@p14 int,@p15 int,@p16 int,@p17 int,@p18 int,@p19 int,@p20 int,@p21 int,@p22 int,@p23 int,@p24 int,@p25 int,@p26 int,@p27 int,@p28 int,@p29 int,@p30 int,@p31 int,@p32 int,@p33 int,@p34 int,@p35 int,@p36 int,@p37 int,@p38 int,@p39 int,@p40 int,@p41 int,@p42 int,@p43 int,@p44 int,@p45 int,@p46 int,@p47 int,@p48 int,@p49 int,@p50 int,@p51 int,@p52 int,@p53 int,@p54 int,@p55 int,@p56 int,@p57 int,@p58 int,@p59 int,@p60 int,@p61 int,@p62 int,@p63 int,@p64 int,@p65 int,@p66 int,@p67 int,@p68 int,@p69 int,@p70 int,@p71 int,@p72 int,@p73 int,@p74 int',@p0=121888,@p1=317624,@p2=278130,@p3=299426,@p4=128786,@p5=553917,@p6=169682,@p7=316993,@p8=319430,@p9=321347,@p10=377276,@p11=388570,@p12=233344,@p13=304376,@p14=318493,@p15=318190,@p16=144455,@p17=342559,@p18=309867,@p19=258251,@p20=139296,@p21=530970,@p22=288191,@p23=127107,@p24=547572,@p25=617531,@p26=238898,@p27=606923,@p28=267113,@p29=140833,@p30=122554,@p31=298846,@p32=562964,@p33=554626,@p34=414874,@p35=534996,@p36=614977,@p37=230423,@p38=261899,@p39=149666,@p40=179537,@p41=148420,@p42=262955,@p43=298094,@p44=575449,@p45=246861,@p46=572334,@p47=172152,@p48=529420,@p49=129074,@p50=266589,@p51=194619,@p52=376201,@p53=608389,@p54=162335,@p55=405965,@p56=125671,@p57=146195,@p58=538850,@p59=575254,@p60=129485,@p61=243677,@p62=615828,@p63=236197,@p64=343015,@p65=294449,@p66=562013,@p67=138933,@p68=614729,@p69=561779,@p70=-1,@p71=-1,@p72=-1,@p73=-1,@p74=-1
Here's the table definition, with indexes:
CREATE TABLE [dbo].[MyTable] (
[MyID] [int] IDENTITY (1, 1) NOT NULL ,
[GrandParentID] [int] NOT NULL ,
[ParentID] [int] NOT NULL ,
[Col1] [nvarchar] (200) COLLATE SQL_Latin1_General_CP1_CI_AS NOT NULL ,
[Col2] [nvarchar] (20) COLLATE SQL_Latin1_General_CP1_CI_AS NOT NULL ,
[Col3] [nvarchar] (200) COLLATE SQL_Latin1_General_CP1_CI_AS NOT NULL ,
[Col4] [nvarchar] (200) COLLATE SQL_Latin1_General_CP1_CI_AS NOT NULL ,
[Col5] [decimal](18, 2) NULL ,
[Col6] [char] (2) COLLATE SQL_Latin1_General_CP1_CI_AS NOT NULL ,
[Col7] [char] (4) COLLATE SQL_Latin1_General_CP1_CI_AS NOT NULL ,
[OtherKey] [int] NULL ,
[Col8] [nvarchar] (50) COLLATE SQL_Latin1_General_CP1_CI_AS NULL ,
[Col9] [datetime] NULL ,
[Col10] [nvarchar] (150) COLLATE SQL_Latin1_General_CP1_CI_AS NULL ,
 CONSTRAINT [PK__7E8439BE] PRIMARY KEY  CLUSTERED
(
    [MyID]
)  ON [PRIMARY]
) ON [PRIMARY]

CREATE  INDEX [MyTable_ParentID] ON [dbo].[MyTable]([ParentID]) WITH  FILLFACTOR = 90 ON [PRIMARY]
CREATE  INDEX [MyTable_OtherKey] ON [dbo].[MyTable]([OtherKey] DESC ) WITH  FILLFACTOR = 90 ON [PRIMARY]
CREATE  INDEX [MyTable_GrandParentID] ON [dbo].[MyTable]([GrandParentID]) ON [PRIMARY]
Here are the timings and IO:
-- Test site - first run:
(7064 row(s) affected)
Table 'MyTable'. Scan count 71, logical reads 49255, physical reads 3, read-ahead reads 13160, lob logical reads 0, lob physical reads 0, lob read-ahead reads 0.
 SQL Server Execution Times:
   CPU time = 140 ms,  elapsed time = 30400 ms.

-- Test site - second run:
(7064 row(s) affected)
Table 'MyTable'. Scan count 71, logical reads 29054, physical reads 0, read-ahead reads 0, lob logical reads 0, lob physical reads 0, lob read-ahead reads 0.
 SQL Server Execution Times:
   CPU time = 78 ms,  elapsed time = 169 ms.

-- Production site - first run:
(7064 row(s) affected)
Table 'MyTable'. Scan count 71, logical reads 50513, physical reads 3, read-ahead reads 13157, lob logical reads 0, lob physical reads 0, lob read-ahead reads 0.
 SQL Server Execution Times:
   CPU time = 62 ms,  elapsed time = 276 ms.

-- Production site - second run:
(7064 row(s) affected)
Table 'MyTable'. Scan count 71, logical reads 29054, physical reads 0, read-ahead reads 0, lob logical reads 0, lob physical reads 0, lob read-ahead reads 0.
 SQL Server Execution Times:
   CPU time = 63 ms,  elapsed time = 262 ms.
The test site and production site are setup the same way - database files are on a single virtual harddrive, which is backed by a many-disk load balancing SAN.
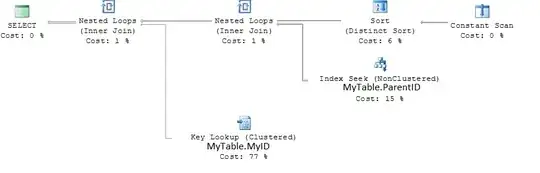
Execution plan: