2

I have a query which takes large time to execute sometimes.When i checked the speed it was taking 15 seconds.But actually it should run faster than that.When i again checked the query it again executed with in 11 sec.Then i tried removing cast used in query and when executed it ran just in 8 seconds.But when i again the original query it takes less time.I checked in several computers running the query.But in some cases i get output just in 1 or 2 seconds also.So there is no consistency with the time taken to execute.So i am not able to find why this happens?

Below is the query i used to test

SELECT [customer].[Customer name],[customer].[Sl_No],[customer].[Id]
FROM [company].dbo.[customer]
WHERE ( Charindex('9000413237',CAST([company].dbo.[customer].[Phone no] AS VARCHAR(MAX)))>0 ) 

Here customer table has about 30 columns.In that 'Customer name' is of datatype varchar(255),'Sl_No' is of int,'Id' is of int and 'Phone no' is of varchar(255).

when i execute the same query(with cast) time required to execute is different even in same PC for different trials.It varies from 1 second to 14 second(i tried number of trials executing query). The variation in time may be due to network lateny,cache,table in high usage by other user etc. But is there any tool or method by which i can find the reason for the time taken(may be slow or fast) to execute?

update I just tried to check IO stalls by using the query

SELECT 
    mf.physical_name,
    ( io_stall_read_ms / ( 1.0 + num_of_reads )) as [avg read wait],
    ( io_stall_write_ms / ( 1.0 + num_of_writes )) as [avg write wait],
    i.name,
    fs.io_stall
    FROM    sys.dm_io_virtual_file_stats(NULL, NULL) AS fs
    INNER JOIN sys.master_files AS mf ON fs.database_id = mf.database_id AND fs.[file_id] = mf.[file_id]
    INNER JOIN sys.databases as i on fs.database_id = i.database_id
order by i.name desc

In the output my database 'company' was taking high io stall.below is the values i got for that database.(The original output had iostall of all database files)

avg read wait-37.17162364 avg write wait -20.66666667 io_stall-4813081 So the database i used in query had high iostall .What is the reason for it?

I added Phone no as non clustered index and just rewrite the query as

SELECT [customer].[Customer name],[customer].[Sl_No],[customer].[Id]
 FROM [company].dbo.[customer]
  WHERE [company].dbo.[customer].[Phone no]  LIKE '%9000413237%'

Now the query executes within 1 second. I cant use LIKE '9000413237%' as i require phone number to be searched at any part of the column.So i hav to use LIKE '%9000413237%'.But in several articles it is mentioned that using like '%abc%' will not benefit indexing only 'abc%' can benefit from indexing. But in my case using LIKE '%9000413237%' helped me a lot with indexing.So i have doubt that why people say using LIKE '%9000413237%' does not benifit

IT researcher
  • 3,168
  • 15
  • 59
  • 82

1 Answers1

6

One possible explanation:

The first time you run your query it's probably not in cache, which means it has to be read from disk and stored in memory. If your query remains the same and execution plan doesn't change, the time it takes to execute the same query will be less.

If the SQL Server you are using is on your own computer and/or others will not be affected, you can clear the plan cache with the DBCC FREEPROCCACHE to see if the execution times remain constant.

You can check to see which queries are in cache by running the following command

SELECT text,objtype, refcounts, usecounts, size_in_bytes,
    disk_ios_count, context_switches_count, pages_allocated_count, original_cost,
    current_cost
FROM sys.dm_exec_cached_plans p
    CROSS APPLY sys.dm_exec_sql_text(plan_handle)
    JOIN sys.dm_os_memory_cache_entries e
    ON p.memory_object_address = e.memory_object_address
WHERE cacheobjtype = 'Compiled Plan'
ORDER BY objtype desc, usecounts DESC

If you see the query

SELECT [customer].[Customer name],[customer].[Sl_No],[customer].[Id]
FROM [company].dbo.[customer]
WHERE ( Charindex('9000413237',CAST([company].dbo.[customer].[Phone no] AS VARCHAR(MAX)))>0 ) 

Then you know its in cache.

If clearing out the cache doesn't make the execution times more consistent, please include the actual execution plan, by selecting CTRL+M before executing your query.

Another possible explanation: Since you are testing from different computers, there could be additional network latency involved when SQL Server sends the data back to the computer you are testing from. You can verify this by using task manager and opening up the Networking Tab when running your query from another server.

Update 15:26

If bandwith was an issue , one solution would be to find out: 1. How much bandwith exists between your clients and server 2. How much bandwith you are actually using

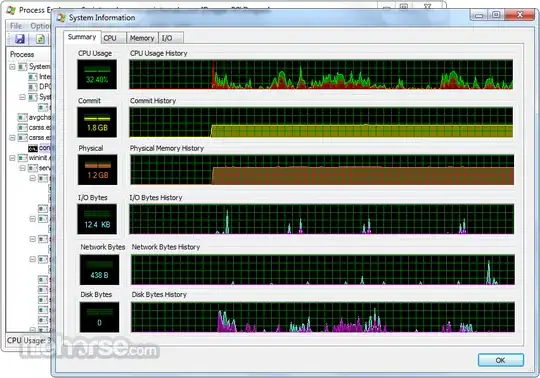
Your network administrator or sysadmin can tell you how much bandwith exists between you and other machines within your domaine. Using Process Explorer or perfmon, you can easily determine how much of that bandwith is being used by SQL Server and other processes. Just keep in mind that when you are executing a query on the server, the results don't have to travel across a network cable as they would with a remote client, which would change execution times.

Your inital question though is why you are seeing inconsistent execution times for the same query. So a discussion about networks and bandwith would be off topic.

Update 09:27

Here are two screenshots of Process Explorer that will help you find the graphs that will allow you to analyze, CPU,IO,Memory and Network traffic.

Main Screen

Main Screen

Graphs

Graphs