SQL Server graphical execution plans read right to left and top to bottom. Is there a meaningful order to the output generated by SET STATISTICS IO ON?
The following query:
SET STATISTICS IO ON;
SELECT *
FROM Sales.SalesOrderHeader AS soh
JOIN Sales.SalesOrderDetail AS sod ON soh.SalesOrderID = sod.SalesOrderID
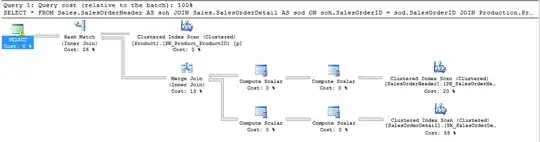
JOIN Production.Product AS p ON sod.ProductID = p.ProductID;
Generates this plan:
And this STATISTICS IO output:
Table 'Worktable'. Scan count 0, logical reads 0, physical reads 0, read-ahead reads 0, lob logical reads 0, lob physical reads 0, lob read-ahead reads 0.
Table 'SalesOrderDetail'. Scan count 1, logical reads 1246, physical reads 3, read-ahead reads 1277, lob logical reads 0, lob physical reads 0, lob read-ahead reads 0.
Table 'SalesOrderHeader'. Scan count 1, logical reads 689, physical reads 1, read-ahead reads 685, lob logical reads 0, lob physical reads 0, lob read-ahead reads 0.
Table 'Product'. Scan count 1, logical reads 15, physical reads 1, read-ahead reads 14, lob logical reads 0, lob physical reads 0, lob read-ahead reads 0.
So, I reiterate: what gives? Is there a meaningful ordering to STATISTICS IO output or is some arbitrary order used?