On our live MySQL 5.5 database server, we use MySQL Workbench for running manual queries, checking running queries to see what's going on, etc.
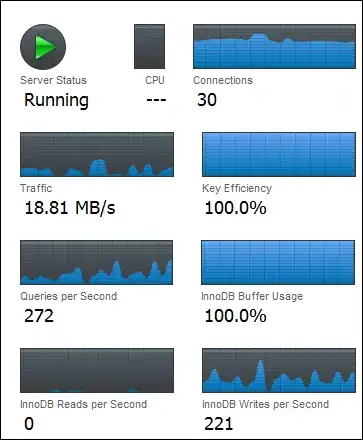
I noticed today that on the "Server Status" tab there's a very high number of "Queries per Second" and "InnoDB Writes per Second", yet on the tab which shows the list of "Client Connections", which shows all running queries, it is barely showing any queries.. perhaps 2 or 3 every few seconds.
What am I misunderstanding here? The two tabs don't add up at all.
EDIT - here's the output for SHOW ENGINE INNODB STATUS;
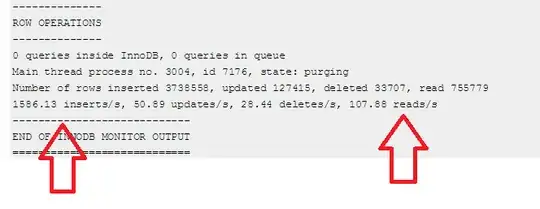
 --------------
 ROW OPERATIONS
 --------------
 0 queries inside InnoDB, 0 queries in queue
 2 read views open inside InnoDB
 Main thread process no. 24494, id 139631733794560, state: sleeping
 Number of rows inserted 36474186, updated 163927609, deleted 11892445, read      1747097889216
 1.06 inserts/s, 13.91 updates/s, 0.00 deletes/s, 33615.95 reads/s
 ----------------------------
 END OF INNODB MONITOR OUTPUT
 ============================