We have a typical master-slave set up. When we find ourselves under considerable load, the master grinds to a halt. The slave continues to march along all happy like.
So during a recent slow-down, I took a VERY simple query (no joins, nicely indexed, not many results) and ran it on the slave and master, with profiling turned on.
Notice how different the results of the profiling are.
Master

Slave

I fear someone might tell me: "Of course your database will perform worse when it's under heavy load." And to them, I say: "You're right!"
But I am really curious if the results from the profile would suggest anything like:
- Your DB server needs more memory, or
- It's writing to disk too much, or
- Change this setting and everything will be fixed, or
- ...
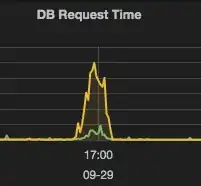
EDIT 1 The following graph shows how queries slow down when we're having a problem. The gold line is average write time and the green line is average read time. As you can see writes get really slow. The average write peaks at around 500 ms. When things are running smoothly, average writes peaks are down around 2ms.