Scenario
I deploy grafana and prometheus onto EKS cluster (AWS K8s service).
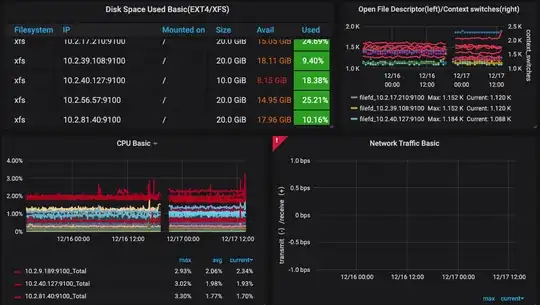
If I use prometheus service's fqdn (prometheus-server.monitoring.svc.cluster.local) as the data source, grafana sometimes fail to load the data like the image below. If I refresh the page several times and if I'm lucky, I'll get all the panels to display correctly.
logging out the grafana pod gives
http: proxy error: dial tcp: lookup prometheus-server.monitoring.svc.cluster.local: no such host
If I use prometheus service's cluster IP address instead of the fqdn, everything works just fine.
Question
What's wrong with using prometheus service's fqdn?
