14

I have been gradually integrating Prometheus into my monitoring workflows, in order to gather detailed metrics about running infrastructure.

During this, I have noticed that I often run into a peculiar issue: sometimes an exporter that Prometheus is supposed to pull data from becomes unresponsive. Maybe because of a network misconfiguration - it is no longer accessible - or just because the exporter crashed.

Whatever the reason it may be, I find that some of the data I expect to see in Prometheus is missing and there is nothing in the series for a certain time period. Sometimes, one exporter failing (timing out?) also seems to cause others to fail (first timeout pushed entire job above top-level timeout? just speculating).

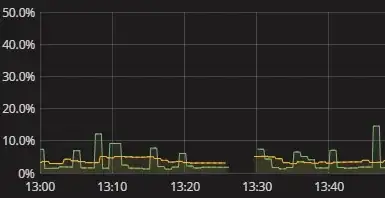
Gap in data

All I see is a gap in the series, like shown in the above visualization. There is nothing in the log when this happens. Prometheus self-metrics also seem fairly barren. I have just had to resort to manually trying to replicate what Prometheus is doing and seeing where it breaks. This is irksome. There must be a better way! While I do not need realtime alerts, I at least want to be able to see that an exporter failed to deliver data. Even a boolean "hey check your data" flag would be a start.

How do I obtain meaningful information about Prometheus failing to obtain data from exporters? How do I understand why gaps exist without having to perform a manual simulation of Prometheus data gathering? What are the sensible practices in this regard, perhaps even when extended to monitoring data collections in general, beyond Prometheus?
Sander
  • 241
  • 1
  • 3
  • 6

3 Answers3

5

I think your can do some kind of alerting on a metric rate with something like this:

ALERT DropInMetricsFromExporter
  IF rate(<metric_name>[1m]) == 0
  FOR 3m
  ANNOTATIONS {
    summary = "Rate of metrics is 0 {{ $labels.<your_label> }}",
    description = "Rate of metric dropped, actually: {{ $value }}%",
}

The main idea is to alert whenever the metric rate is at 0 for 3 minutes, with the proper metric name and a label somewhere telling from which exporter it comes it should give you the correct information.

Choosing the right metric to monitor by exporter could be complex, without more insight is hard to give a better advice out of vacuum.
This blog post could be an inspiration also for a more generic detection.

Tensibai
  • 11,416
  • 2
  • 37
  • 63
1

There are a few reasons which might have caused the gap. Most likely the exporter isn't reachable in which case the up timeseries will be 0. You can alert on this like this (taken from https://prometheus.io/docs/alerting/rules/#templating):

# Alert for any instance that is unreachable for >5 minutes.
ALERT InstanceDown
  IF up == 0
  FOR 5m
  LABELS { severity = "page" }
  ANNOTATIONS {
    summary = "Instance {{ $labels.instance }} down",
    description = "{{ $labels.instance }} of job {{ $labels.job }} has been down for more than 5 minutes.",
  }

On the status page you should also see that it's down including an error message. Unfortunately there is no way to see past error but there is an issue to track this: https://github.com/prometheus/prometheus/issues/2820

Your Prometheus server can be also overloaded causing scraping to stop which too would explain the gaps. In that case you should see Storage needs throttling. Scrapes and rule evaluations will be skipped. errors in the log and increases in the prometheus_target_skipped_scrapes_total metrics. You should alert on that too, e.g:

ALERT PrometheusSkipsScrapes
  IF rate(prometheus_target_skipped_scrapes_total[2m]) > 0
  FOR 5m
1

I'm not sure if this is the same problem you are seeing. But we saw these random gaps for Java applications that did not specifically set the GC settings. Meaning we were seeing gaps when the data collection stopped because the activity for the instance stopped while the JVM was doing a Full GC. If you are using Java this can happen. Our fix was to explicitly use the G1 garbage collector (Java 8+) with a specified limit on the length of GC activity to prevent these time gaps in the data collection.

cwa
  • 11
  • 2