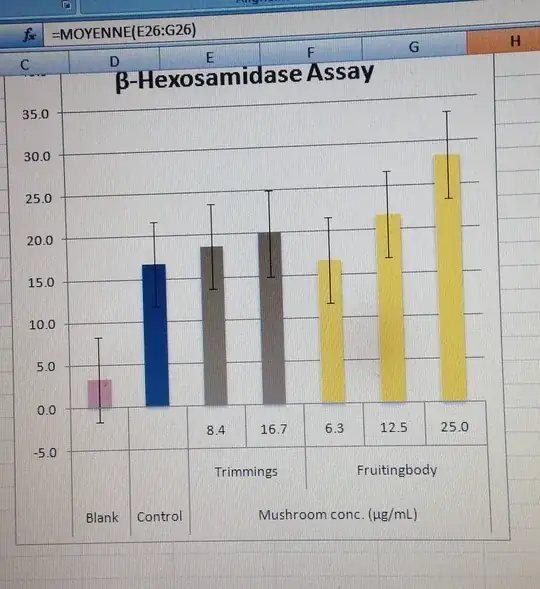
I want to have a star dot above each bar chart. I don't know how to present that index. Please anyone help me to resolve this problem,
I want to have a star dot above each bar chart. I don't know how to present that index. Please anyone help me to resolve this problem,
Quite seriously: Friend Don't Let Friends Use Excel. Learn to use Matlab/Octave, or python, or R, or just plain Gnuplot.
No matter what tool you use, since "significance" is a separate variable, you need to convert your collection of "*" , "**" etc to numeric values and plot the desired symbols at the matching category locations.