This is a long answer because I need to cover a lot of things. IF something is doesn't make sense let me know.
What are those diagrams
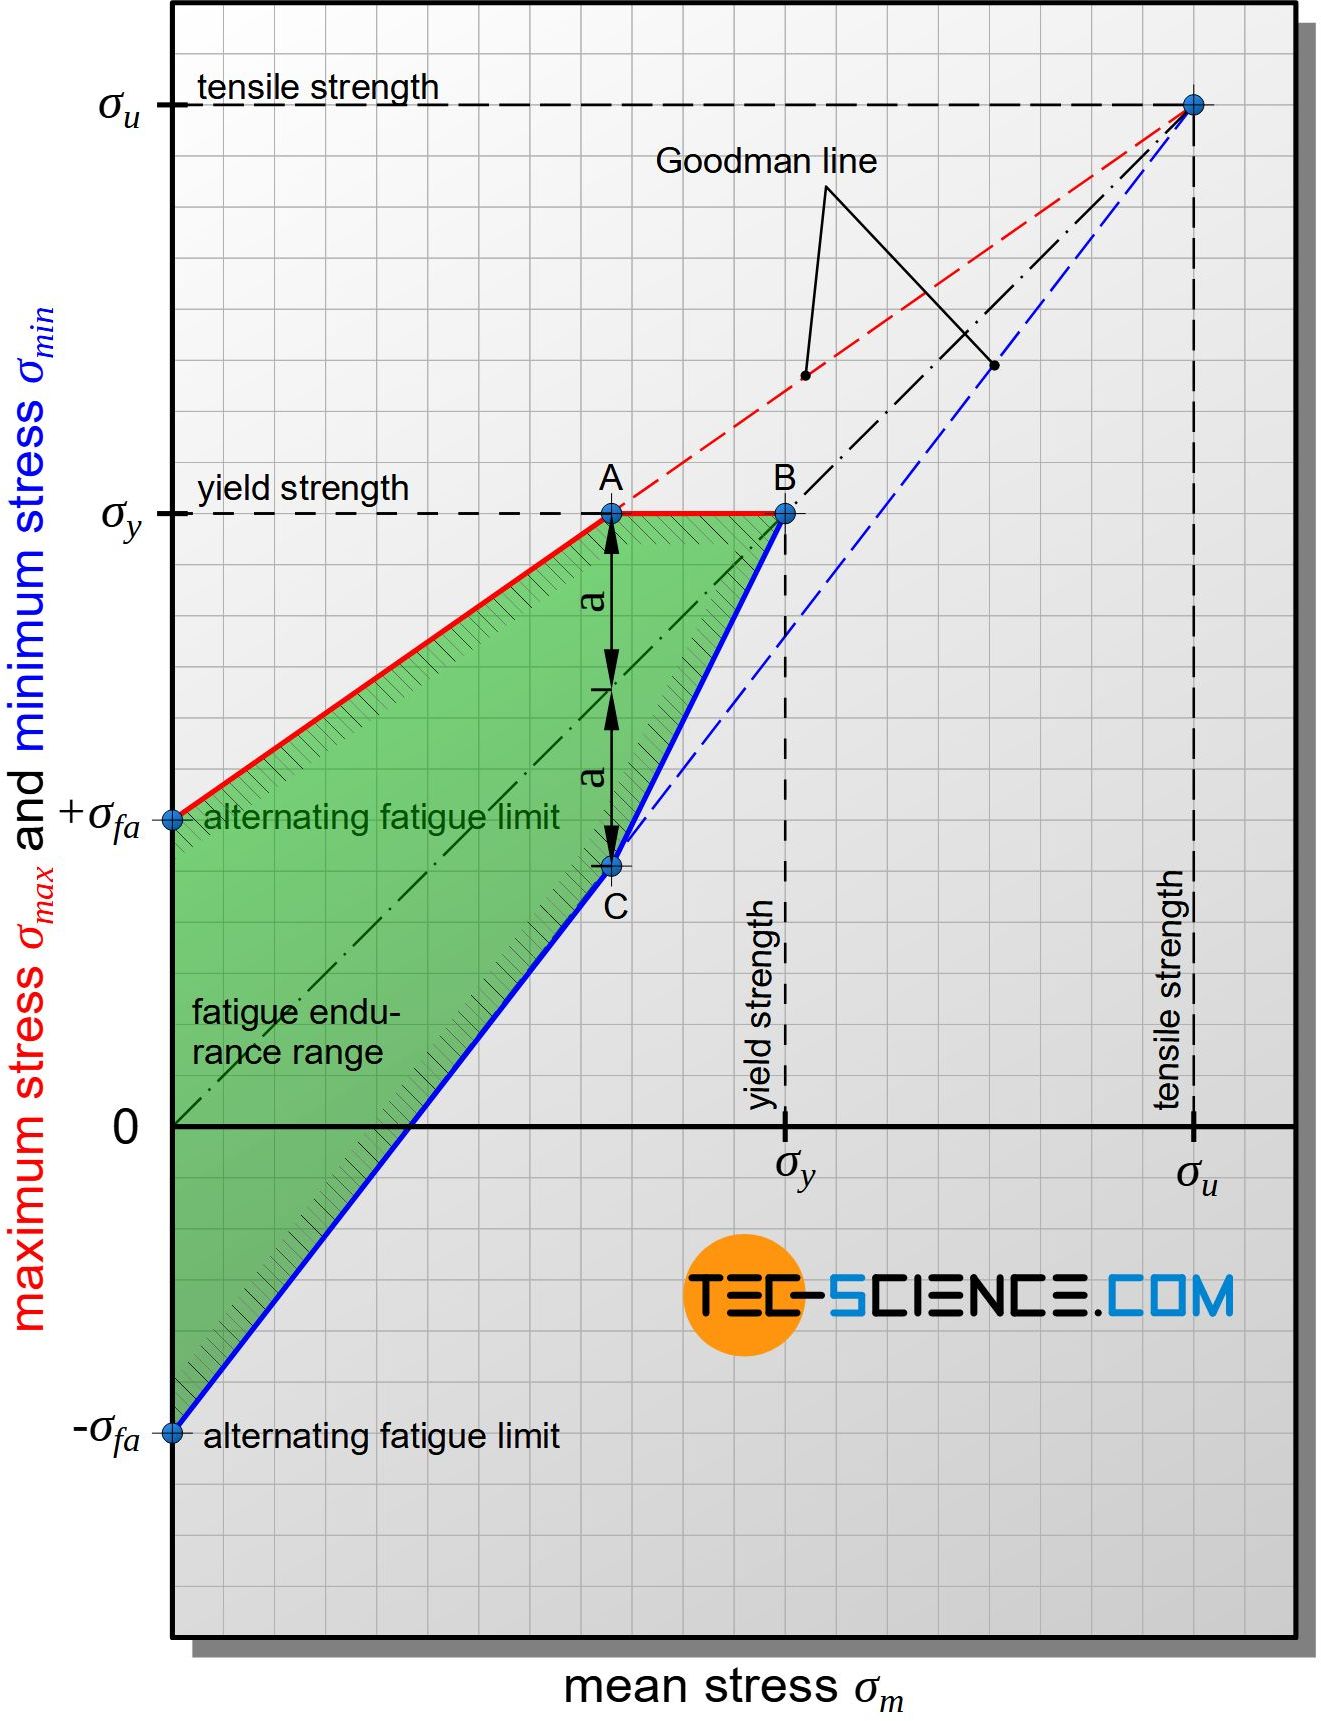
The Modified Goodman and the Smith diagram (and others) are diagrams that hope to predict the life of a material under fatigue loading.
types of Fatigue loading
The problem with fatigue loading is that it is not defined in a single way. There are (usually) two ways to describe fatigue loading, ie. by providing:
- the maximum $\sigma_{max}$ and the minimum $\sigma_{min}$
- the mean $\sigma_{m}$ and the amplitude $\sigma_{a}$ (sometimes also denoted as $\sigma_{r}$)
Both of the provide the same information in different way (e.g. $\sigma_{m} = \frac{\sigma_{max}+\sigma_{max}}{2}$, $\sigma_{max} = \sigma_{m}+\sigma_{a}$)
The following image gives the different type of fatigue loading.
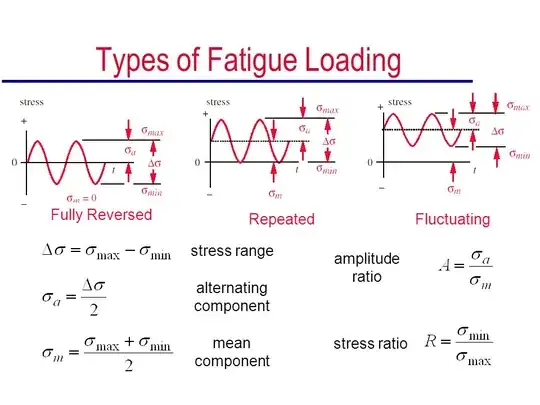
For a given maximum stress $\sigma_{max}$, the worst type of loading is the fully reversed (i.e. $\sigma_{m}=0$ and $\sigma_{a}=\sigma_{max}$).
S-N diagrams
The S-N diagrams are constructed by applying a constant loading profile (i.e. different $\sigma_m$, $\sigma_a$). Most commonly the loading profile is fully reversed but that is not necessary.
Each S-N diagram can estimates a threshold (i.e. load that the material can withstand a high number of loading cycles -- typically $10^6$).
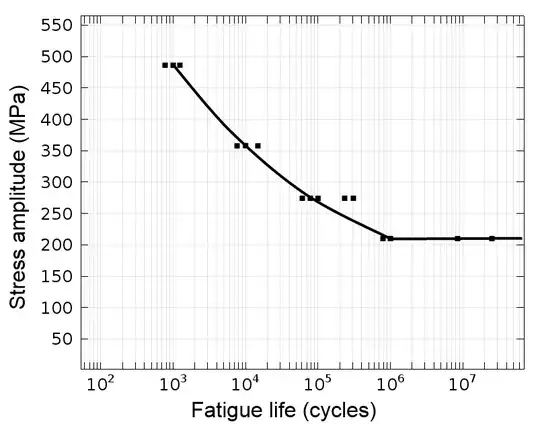
Figure: An S-N curve. The black squares represent individual fatigue tests. Fatigue life Threshold is related to the flat line to the right of the image (source comsol)
How to construct the diagrams.
All the models (Goodman, Soderberg, Smith, etc) typically use
- a measure of the tensile strength (usually the UTS, but sometimes the yield strength also),
- a measure of the fully reversed fatigue loading $S_N$
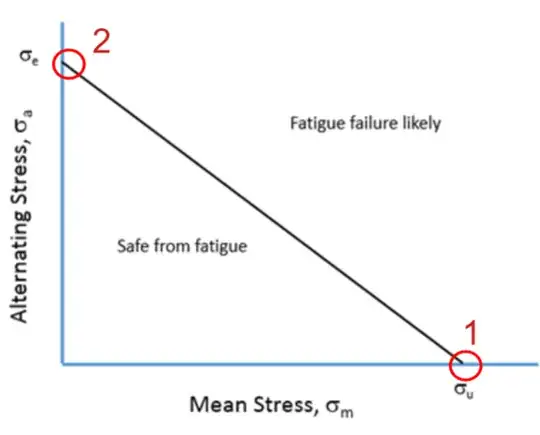
No.1 (the measure of tensile strength) determines the X intercept of the graph (see image above lower right). This is essentially the case when a constant load is applied. The load results in stress $\sigma_m$ and also $\sigma_m=\sigma_{max}=\sigma_{min}$ (i.e. there is no alternating load).
No.2 (the measure of fatigue threshold) determines the Y intercept of the graph (see image top left). This is essentially the case when a fully reversed load is applied.
The actual models (Goodman, Smith, Soderberg, etc) where developed for different profiles of $\sigma_m$, $\sigma_a$. E.g. see below for data points (each datapoint represent a different S-N diagram with a $\sigma_m$, $\sigma_a$ combination):
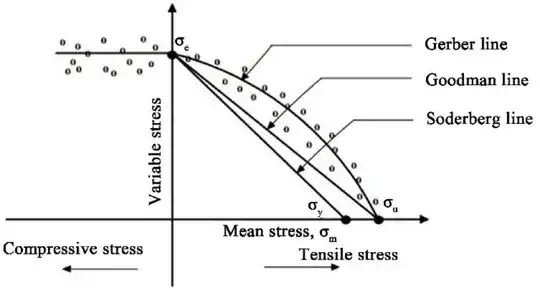
Figure: A typical schematic showing Gerber, Goodman and Soderberg lines and relation between the variable stress and the mean stress in an ideal fatigue test (sourceNPTEL Courseware)
However, because fatigue testing is time, money and resource consuming, it is very seldom nowadays to perform the entire test, and nominally you take advantage of the work that established the models, and you only need two data points (a measure of strength and a measure of fatigue strength).


