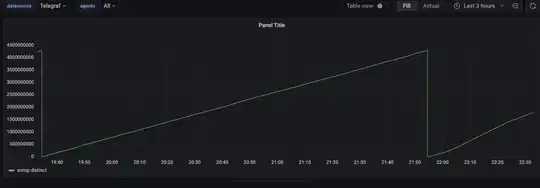
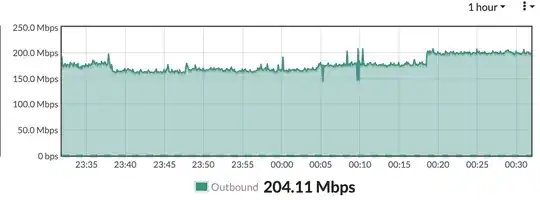
I am getting a sawtooth style of graph on Grafana when I am tying to monitor the ISP WAN interface of my Fortinet firewall. Can someone please guide me on getting the right graph for the WAN interface bandwidth? The fortinet shows a much smoother and flatter curve but my graph is a sawtooth, here is my OID, oid = "1.3.6.1.2.1.2.2.1.16.187" where 187 is the interface snmp index. Please guide me on this.
Asked
Active
Viewed 860 times

