I have a Cisco/Meraki MS225 switch with four SFP+ ports. I have a fiber optic module in one of those ports. All five of the DOM values are showing as in critical state. I'm suspicious that the thresholds are set incorrectly and that's at least part of the problem.
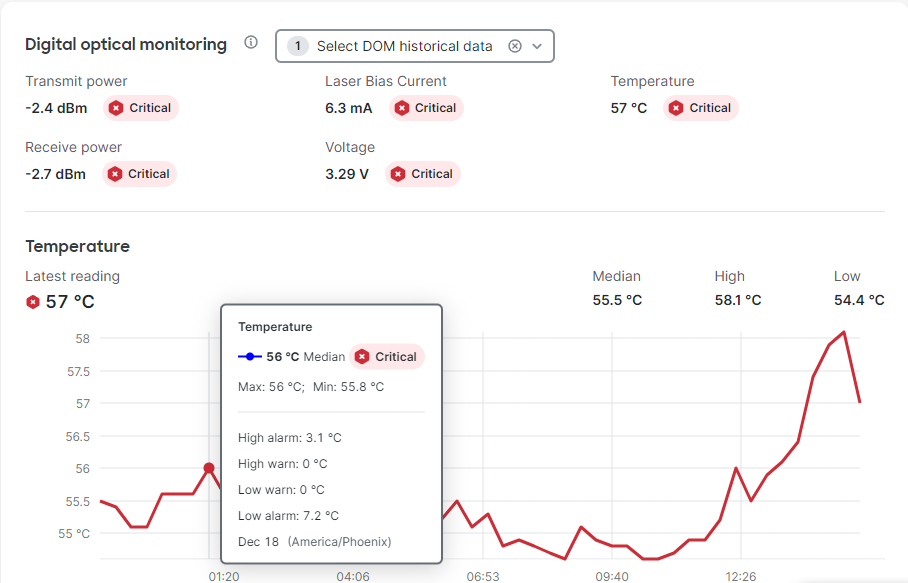
In the popup when hovering over the graph, you can see that it shows the high warning at zero degrees and high alarm at 3.1 degrees.
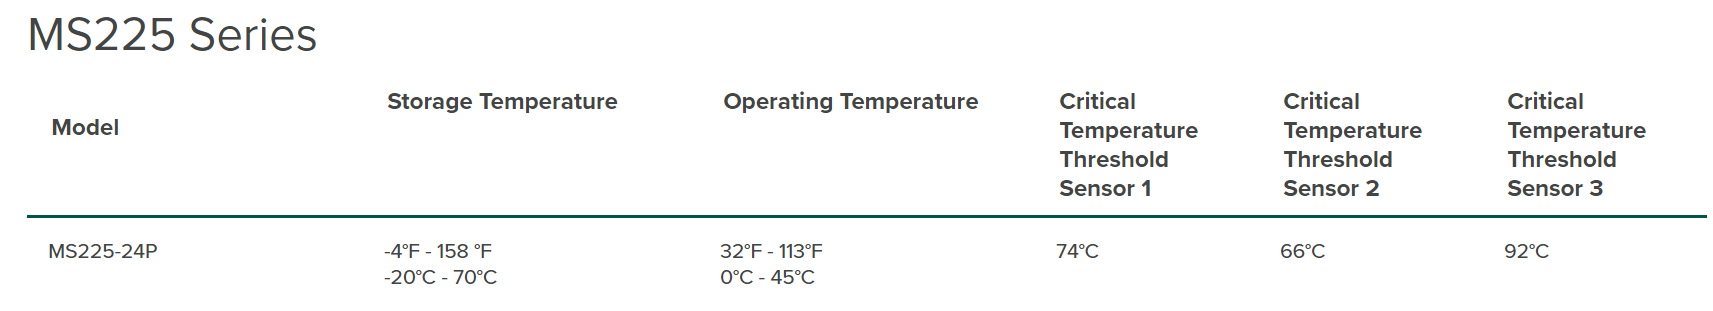
On the Cisco site (https://documentation.meraki.com/MS/Monitoring_and_Reporting/MS_Temperature_Thresholds),
I find that the critical temperatures are well above the 57 degrees the module is currently at.
That makes me question all the other thresholds (though I don't know what would truly represent concerning values for those parameters yet). Those other thresholds have similarly odd values.
For instance, the transmit power:
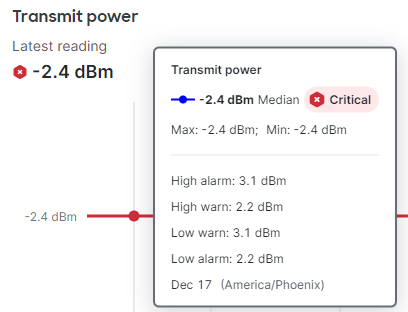
The Low Warn and High Alarm are the same value and the Low Alarm and High Warn are the same value. Seems like something is seriously messed up, unless this is just a UI error in the Meraki Dashboard.
So, there are two questions:
- Are these thresholds held in the switch, in the Meraki Dashboard settings or in the fiber module itself?
- Wherever they are, can they be changed or reset and how?