I'm fighting for quite a while with the really poor documentation regarding sensors that should digest XML output in PRTG, e.g. How can I get multiple values from single HTTP XML/REST Value Sensor that stated that it's not possible 13 years ago.
Hoping that software actually made some progress meanwhile, so this workaround wouldn't be needed any more:
As a workaround, you can add two HTTP XML/REST sensors, one for every value and then use a Factory Sensor, to show both graphs within one sensor.
Actually I had tried it, bit it feels like a real mess (i.e.: way too complicated for a little effect).
Well, the list of complaints against the (mis-)use of XML in PRTG could be quite long, but here is what I have as sample output:
?xml version="1.0" encoding="UTF-8"?>
<!--MonitoringOutput v0.2 id=NRPE@local:LDM_5_MDB_Free (PRTG.xsl v0.0.6)-->
<Prtg>
  <!--Description: "LDM_5_MDB_Free"-->
  <!--Status String: CRITICAL-->
  <!--Exit Code: 2-->
  <!--Info String: [4/4 Databases], [CRIT DB3.PagesFreeMinPct: 0.00391 < 10], [CRIT DB3.PagesFreeMaxPct: 3.4805 < 10], [2 searches with 5 entries in 0.054s], ...-->
  <!--BEG: valid perf_data-->
  <Text>CRITICAL</Text>
  <Result>
    <Channel>DB1.PagesFreeMinPct</Channel>
    <Value>55.578</Value>
    <CustomUnit>%</CustomUnit>
    <LimitMinWarning>15</LimitMinWarning>
    <LimitMinError>10</LimitMinError>
  </Result>
  <Result>
    <Channel>DB1.PagesFreeMaxPct</Channel>
    <Value>60.414</Value>
    <CustomUnit>%</CustomUnit>
    <LimitMinWarning>15</LimitMinWarning>
    <LimitMinError>10</LimitMinError>
  </Result>
  <Result>
    <Channel>DB3.PagesFreeMinPct</Channel>
    <Value>0.00391</Value>
    <CustomUnit>%</CustomUnit>
    <LimitMinWarning>15</LimitMinWarning>
    <LimitMinError>10</LimitMinError>
  </Result>
  <Result>
    <Channel>DB3.PagesFreeMaxPct</Channel>
    <Value>3.4805</Value>
    <CustomUnit>%</CustomUnit>
    <LimitMinWarning>15</LimitMinWarning>
    <LimitMinError>10</LimitMinError>
  </Result>
  <Result>
    <Channel>DB4.PagesFreeMinPct</Channel>
    <Value>86.328</Value>
    <CustomUnit>%</CustomUnit>
    <LimitMinWarning>15</LimitMinWarning>
    <LimitMinError>10</LimitMinError>
  </Result>
  <Result>
    <Channel>DB4.PagesFreeMaxPct</Channel>
    <Value>96.484</Value>
    <CustomUnit>%</CustomUnit>
    <LimitMinWarning>15</LimitMinWarning>
    <LimitMinError>10</LimitMinError>
  </Result>
  <Result>
    <Channel>DB5.PagesFreeMinPct</Channel>
    <Value>23.773</Value>
    <CustomUnit>%</CustomUnit>
    <LimitMinWarning>15</LimitMinWarning>
    <LimitMinError>10</LimitMinError>
  </Result>
  <Result>
    <Channel>DB5.PagesFreeMaxPct</Channel>
    <Value>27.918</Value>
    <CustomUnit>%</CustomUnit>
    <LimitMinWarning>15</LimitMinWarning>
    <LimitMinError>10</LimitMinError>
  </Result>
</Prtg>
Note: In PRTG version 25.2.106.1114+ the XML parser is broken as it cannot parse XML comments like the one shown.
I was able to extract a single value using XPath expression /Prtg/Result[Channel[text()='DB1.PagesFreeMaxPct'>/Value using the "HTTP XML/REST Value" sensor, but that cannot be the ways to go:
What is the use of using XML when I have to use XPath to extract the values from the structure?
Isn't XML there to allow programs to process the structure they define?
So the output has eight channels, group-able in four databases, and each database has the two channels PagesFreeMinPct and PagesFreeMaxPct.
So isn't it still impossible in PRTG?
Asking AI:
I had asked "o4-mini" about the problem, and the response was:
In PRTG you can absolutely pull out multiple channels from a single XML REST‐call—complete with dynamic channel names—by using the built-in HTTP XML/REST sensor (Advanced mode) and its “table slicing” feature.
However I could not locate that sensor mode, nor the “table slicing” feature anywhere...
Just in case
The XML shown had been converted from Nagios-compatible output actually, so for reference the monitoring output looks like this:
CRITICAL: [4/4 Databases], [CRIT DB3.PagesFreeMinPct: 0.00391 < 10], [CRIT DB3.PagesFreeMaxPct: 3.4805 < 10], [2 searches with 5 entries in 0.056s], Time.Uptime=608224, DB1.PagesFreeMinPct=55.578%, DB1.PagesFreeMaxPct=60.414%, DB3.PagesFreeMinPct=0.00391%, DB3.PagesFreeMaxPct=3.4805%, DB4.PagesFreeMinPct=86.328%, DB4.PagesFreeMaxPct=96.484%, DB5.PagesFreeMinPct=23.773%, DB5.PagesFreeMaxPct=27.852%|DB1.PagesFreeMinPct=55.578%;15:;10:;0;100 DB1.PagesFreeMaxPct=60.414%;15:;10:;0;100 DB3.PagesFreeMinPct=0.00391%;15:;10:;0;100 DB3.PagesFreeMaxPct=3.4805%;15:;10:;0;100 DB4.PagesFreeMinPct=86.328%;15:;10:;0;100 DB4.PagesFreeMaxPct=96.484%;15:;10:;0;100 DB5.PagesFreeMinPct=23.773%;15:;10:;0;100 DB5.PagesFreeMaxPct=27.852%;15:;10:;0;100
Partial Success
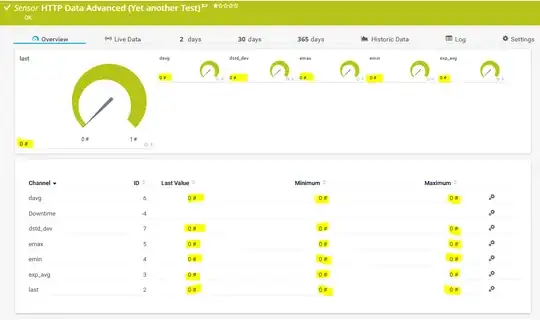
Using sensor "HTTP Data Advanced" and this XML output, I see each channel with the correct label:
<?xml version="1.0" encoding="UTF-8"?>
<Prtg>
  <Text>OK</Text>
  <Result>
    <Channel>last</Channel>
    <Value>0.0010811</Value>
  </Result>
  <Result>
    <Channel>exp_avg</Channel>
    <Value>0.0004177</Value>
  </Result>
  <Result>
    <Channel>emin</Channel>
    <Value>0.0003247</Value>
  </Result>
  <Result>
    <Channel>emax</Channel>
    <Value>0.0010811</Value>
    <LimitMaxWarning>0.25</LimitMaxWarning>
    <LimitMaxError>0.75</LimitMaxError>
  </Result>
  <Result>
    <Channel>davg</Channel>
    <Value>0.0005801</Value>
    <LimitMaxWarning>0.025</LimitMaxWarning>
    <LimitMaxError>0.035</LimitMaxError>
  </Result>
  <Result>
    <Channel>dstd_dev</Channel>
    <Value>0.0004339</Value>
  </Result>
</Prtg>
But all values are displayed as zero ("0 #"), and the provided thresholds are being ignored.
Asking AI about it, it claims that only three fractional digits are considered, and it's not a bug in PRTG, but a design feature.
Now for the example these are I/O response times that are usually well below one millisecond, but in case of errors they can go up to multiple seconds, so using milliseconds as normal unit does not make much sense IMHO.
