3

Related to this question: How can a Perfmon "% Processor Time" counter be over 100%?

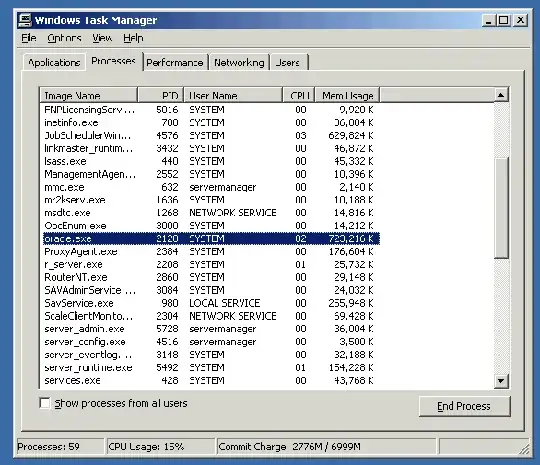
I was manually observing processes in Task Manager when a user reported a problem and the Oracle process was using 80%-95% for a sustained period of time (5-15 minutes).

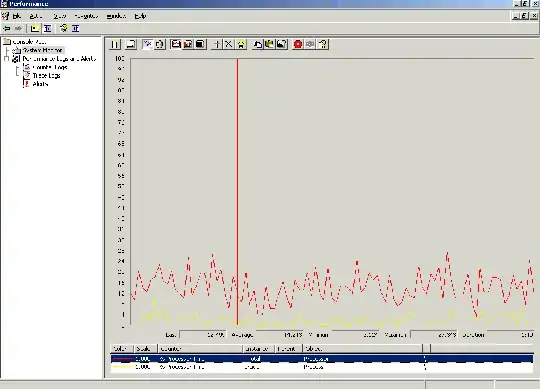
So I've been using perfmon for the last couple days to track that process and noticed it going OVER 100% for short periods, so it's apparently in perfmon it's the total over all the processors.

My question is that the 80-95% I was seeing in Task manager would really have been corresponding to 160-180% in perfmon, right?

(obviously factoring in that some processes may not be able to use all processors efficiently).

Task Manager was showing 80-95% CPU here:

enter image description here

Perf Monitor can spike above 100% on the line for a single process object:

enter image description here

Cade Roux
  • 375

1 Answers1

2

Examining Processor Time Data on MSDN

On multiprocessor systems, the Processor\% Processor Time value reported by System Monitor will never exceed 100 percent for any particular processor or thread.

On the other hand, the value of the % Processor Time reported for the Process object can report values over 100 percent; if such values occur, this could indicate that threads of the process are cumulatively using more than 100 percent of a processor.


It basically says that when examining a Process (with multiple paths of execution), you'd see over 100% if there are more than one core running the code concurrently. Process has multiple cores available to it, and it can choose to run on a few.

On the other hand, if examining a CPU Thread, you'd never see a value above 100%, since that's the actual resource being measured. CPU Thread is Microsoft speak for CPU Core: there are two Threads in an HT-enabled core.

GregC
  • 889