I am running amazon aws ec2 micro instance on Ubuntu 14.04 with apache 2.4.9.
The reason for having this instance is just to test and to solve some bugs before rolling up the project. Currently there are only few people (< 10) who are using the project irregularly (< 20 times per day). In my project I am using minification, so I have only few static content there: like 1 css file and may be 3 js files. They are not really big and the sum of all files is below 300Kb.
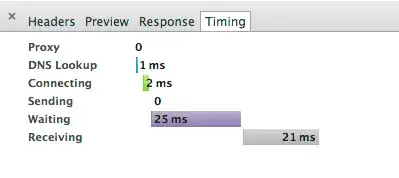
Reviewing the waterfall diagram, from loading of my project,

I have noticed that was amount of time is spent on waiting phase (if I will remove it, most probably the web-site will be loaded more than 2 times faster). Also I known what each of these phases corresponds to (I even answered highly relevant question here), I do not know what exactly can I do to decrease waiting time. In my case big waiting time is added for static resources like css/js/img, so it has nothing to do with writing more efficient code.
I also found another highly relevant question here (which is actually the same question I have) and tried to follow the advice by switching of HostnameLookups Off but it has not changed anything at all.
I do not have /etc/httpd/conf/httpd.conf, therefore I added it into /etc/apache2/sites-available/000-default.conf. Also I do not have anything like LogFormat in my config, therefore I skipped this part.
So is there anything I can do to reduce this time? When I review the same diagram collected from the location of the server, I see small improvement in waiting time, but the situation is still the same.
I do understand that I can move to a better server, with better HDD/RAM/CPU, but this is obvious. Knowing that there are so many configuration parameters for apache, I think that may be there is something there for tuning.
P.S. thanks to JakeGould I looked into apache2.conf and modified it (not 000-default.conf as I mentioned before). I also modified KeepAliveTimeOut to 3 and MaxKeepAliveRequests to 20 which is more suited to my site.