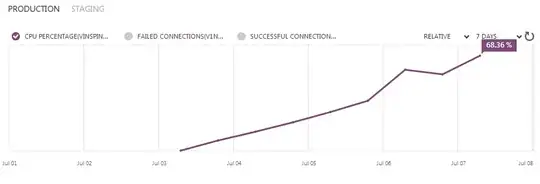
The picture explains it all. We have had a problem with an IIS MVC 5 website hosted on Microsoft Azure over the last several months. The site appears to continually eat up CPU over a few days until it reaches 100% CPU. I have used Perfmon/DebugDiag to capture what is going on when the server hits 100% with no positive findings. I've also monitored IIS worker processes to see if it is any one particular request hanging, but all requests are being processed quickly (until 100%). Grasping at straws - we have had peer checks of code to ensure no bad loops/string concats are occurring.
My guess is this has something to do with the garbage collector... Resetting the app pool fixes the issue (for a few days).
Any insight would be appreciated as to how to debug this further. I have followed this Microsoft article without success: http://www.iis.net/learn/troubleshoot/performance-issues/troubleshooting-high-cpu-in-an-iis-7x-application-pool
Thanks.