4

I've got some GigabitEthernet Vision cameras, which use Ethernet to communicate. The protocol is simple UDP, but for performance reasons (high packet throughput causing CPU load) the manufacturer uses a filter driver that prevents those packets from showing up while capturing with WinPCap/Wireshark.

The software which comes with the cameras needs the filter driver to work (there is no plain UDP-Socket fallback) and I would like to analyze it's traffic. I would like to avoid the need for capturing using additional hardware and prefer a software-only solution to this.

Question: Is there any way to prioritize WinPCap, so that it handles the packets before the filter driver?

System-Info:

  • OS: Windows 10 (64-bit)
  • Software: Wireshark 2.4.4[-0-g90a7ve11a4]
  • Capture Driver: WinPCap v4.1.3 (packet.dll version 4.1.0.2980)
  • RealTek: USB-GbE-Adapter (Driver Version 10.7.218.2016)

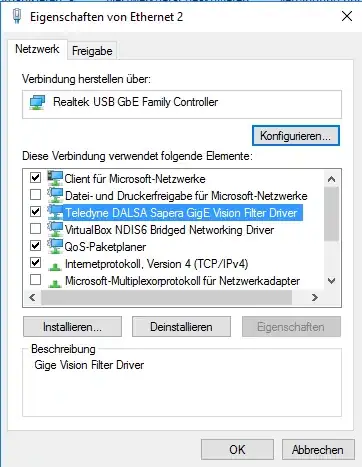
Screenshot of Adapter Configuration (in German, sorry):

enter image description here

This is a screenshot from my network interface settings (the marked driver 'Teledyne DALSA Sapera GigE Vision Filter Driver' is the relevant one).

SDwarfs
  • 375

2 Answers2

3

If the cameras are connected to a hub you can plug a laptop into the hub and capture in promiscuous mode.

If the cameras are connected to a switch you can configure a mirrored port (mirror the port the camera is plugged into to a port you plug a machine doing the wireshark capture into).

If the cameras are plugged directly into the computer you are running Wireshark on make sure TCP Chiminey is off.

Here are some links that appear to be related to trying to resolve this exact issue.

https://networkengineering.stackexchange.com/questions/34961/why-does-wireshark-not-show-all-traffic-especially-gvsp-data

https://www.wireshark.org/docs/dfref/g/gvsp.html

https://wiki.wireshark.org/CaptureSetup/Offloading#TCP_Chimney

It would also be helpful if you provided more information about the camera (i.e. what is/are the camera model(s)?) and your network topology (e.g. are the cameras connected to the computer you are running Wireshark on, a hub, or a switch?).

Edit: What you are actually asking is to manually change the order of Winsock catalog entries (Layered Service Provider). By running netsh winsock set /? you can see what your options are for configuring Winsock directly. From everything I see no there is not a way for you to change the order of LSPs.

https://docs.microsoft.com/en-us/previous-versions/windows/it-pro/windows-server-2008-R2-and-2008/cc753591(v=ws.10)

https://msdn.microsoft.com/en-us/library/windows/desktop/gg581810(v=vs.85).aspx

https://blog.malwarebytes.com/cybercrime/2014/10/changes-in-the-lsp-stack/

user5870571
  • 3,250
2

I had the same problem with Matrox Imaging Library filter driver and Wireshark not able to capture packets. Turns out netsh trace is able to capture the data. It is unfortunately slow and uses a lot of disk space and takes forever to save, but it is able to see the traffic. - Correction: by using report=disabled it is now fast. netsh trace with defaults or with report=no will create a cab file with system info, for some reason this takes forever the longer you trace for if you have high data rates, but with report=disabled the trace writes out within 10 seconds instead of taking minutes or longer.

You need to convert the etl file to a pcapng file then Wireshark version 3.6+ can read it, Microsoft created etl2pcapng to convert the file: https://github.com/microsoft/etl2pcapng.

The directions are outlined here https://techcommunity.microsoft.com/blog/coreinfrastructureandsecurityblog/converting-etl-files-to-pcap-files/1133297:

netsh trace start capture=yes report=disabled maxsize=1024 filemode=circular tracefile=c:\temp\file.etl
netsh trace stop
etl2pcapng.exe file.etl newfile.pcapng

Then you can open the pcapng file in Wireshark and it displays like normal.

Beware: etl2pcapng will input a comment showing the PID and Thread of the "current process" but it was mostly useless data for me. The person who wrote that feature made a blog post about it here https://blog.didierstevens.com/2020/01/28/etl2pcapng-support-for-process-ids and includes this response from Microsoft,

The output pcapng file will have a comment on each packet indicating the PID of the current process when the packet was logged. WARNING: this is frequently not the same as the actual PID of the process which caused the packet to be sent or to which the packet was delivered, since the packet capture provider often runs in a DPC (which runs in an arbitrary process). The user should keep this in mind when using the PID information.

For me it was showing seemingly random processes, turns out this data is taken in by the network stack using a Deferred Procedure Call, and DPCs actually re-use the execution context of the thread that was interrupted to do the packet capture processing! So you can have notepad.exe be interrupted and its own execution context is then used by the "packet capture provider", this causes the notepad.exe PID to be listed in the resulting .pcapng file taken from the netsh trace data despite it otherwise being wholly unrelated (kinda cool to see exactly what was interrupted and when to process that packet though).
Evelyn
  • 21