11

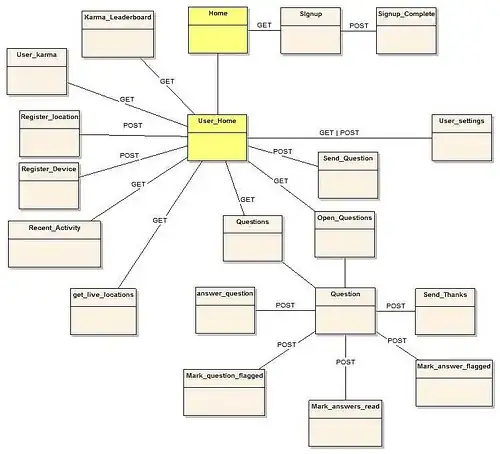
Does anybody have suggestions on creating a flowchart representation of a REST-style web interface? In the interest of supplying thorough documentation to co-developers, I've been toying around in dia modeling the interface for modifying and generating a product resource:

enter image description here

This particular system begins to act differently with user authentication/resource counts, so before I make modifications, I'm looking for some clarification:

  • Complexity: how would you simplify the overall structure to make this easier to read?
  • Display Symbol: is this appropriate for representing a page?
  • Manual Operation Symbol: is this appropriate for representing a user action like a button click?

Any other suggestions would be greatly appreciated.

My apologies for the re-post. The main stackexchange site suggested this question was better presented on programmers.

TheLQ
  • 13,650
  • 7
  • 56
  • 88

3 Answers3

12

I feel Message Sequence Chart/Sequence diagram is better suited for documenting RESTful API interaction. What you have is a state diagram, while RESTful API by definition is stateless.

enter image description here

vartec
  • 20,846
1

I definitely think a state machine is the right way to document that interactions of a RESTful system. However, I am still working on the right way to represent the hypermedia factors in the diagram. Here are a couple of experimental diagrams that I have done.

Maze

enter image description here

0

My two pennies on the subject, as I am working with this at the moment:

  • focus on resources and their relations
    • and not on the action, and thus the HTTP method
    • when you follow a link, no matter if you did a GET or POST, your next possible states are dictated primarily by the current resource, and much less by the request's HTTP method

With that in mind:

  • remove some obvious links (i.e. to self, to root)
  • remove the relations' label if it just states "this [car] has a [owner]", where the source resource is car and the target resource is owner. It doesn't add anything
  • an interactive graph can be of great help with a complex state diagram (example)