6

I have run into some pre-existing SQL that I'm having a hard time uderstanding.

SELECT
    MAX(I.Symbol) Symbol
,   MAX(I.Ticker) CUSIP
,   MAX(I.Name) Name
,   SUM(H.Quantity) TotalQuantity
,   SUM(H.MarketValue) TotalMarketValue
,   MAX(H.PriceLC) Price
,   MAX(I.CategoryCode5) BUY_SELL
,   MAX(I.EquivFactor1) PriceTgt
,   MAX(P.LastPrice) CurrPrice
,   MAX(I.AssetClass) Target
,   MAX(I.Industry) Industry
,   MAX(I.CategoryCode1) Risk
FROM
    HOLDINGS_SECURE H
,   INVESTMENTS I
,   PRICE P
WHERE
    H.Symbol = I.Symbol
    AND I.Product = 'stock'
    AND H.Quantity > 0
    AND I.CategoryCode5 NOT IN ('X', '')
    AND H.Symbol = P.Symbol
GROUP BY
    I.Symbol

Symbol, Ticker, Name, CategoryCode5, Assest Class, Industry, and CategoryCode1 are all varchar fields. The remaining fields are decimals.

My best educated guess is that somehow max is being used to avoid multiple grouping columns but how can this return the correct results?

Tables Relational Diagram

W.Jackson
  • 218
  • 3
  • 9

2 Answers2

8

You say: "My best educated guess is that somehow max is being used to avoid multiple grouping columns"

That is correct.

and then: "... but how can this return the correct results?"

It returns correct results because the Symbol is the primary key in both the Investments and the Price tables. Therefore, any aggregate function over a P.column or an I.column is aggregating identical values. And MAX(c) when c is 2, 2, 2 or 2 is of course 2.

Could the query be written somehow else, possibly without all these aggregations? Yes, see a related question: Why do wildcards in GROUP BY statements not work?

It would have to be a rather long GROUP BY clause or have the aggregations moved into a subquery with only the Holdings_Secure table (where Symbol is not the Primary key) and then joined to the other two:

SELECT
    I.Symbol Symbol
,   I.Ticker CUSIP
,   I.Name Name

,   H.TotalQuantity
,   H.TotalMarketValue
,   H.Price

,   I.CategoryCode5 BUY_SELL
,   I.EquivFactor1 PriceTgt
,   P.LastPrice CurrPrice
,   I.AssetClass Target
,   I.Industry Industry
,   I.CategoryCode1 Risk
FROM
    ( SELECT 
          SUM(Quantity) TotalQuantity
      ,   SUM(MarketValue) TotalMarketValue
      ,   MAX(PriceLC) Price
      ,   Symbol
      FROM
          HOLDINGS_SECURE
      WHERE
          Quantity > 0
      GROUP BY
          Symbol
    ) H
  JOIN
    INVESTMENTS I
      ON H.Symbol = I.Symbol
  JOIN
    PRICE P
      ON H.Symbol = P.Symbol
WHERE
        I.Product = 'stock'
    AND I.CategoryCode5 NOT IN ('X', '') ;
ypercubeᵀᴹ
  • 99,450
  • 13
  • 217
  • 306
4

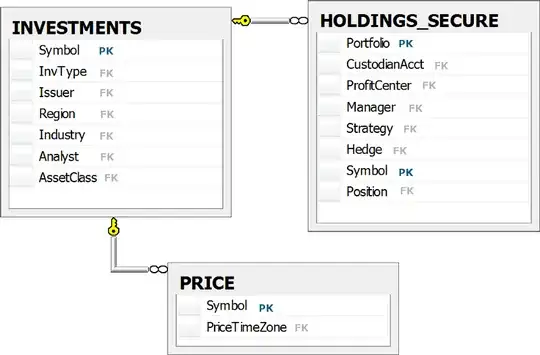
It could be that the aggregations fit better in a subquery, and make more sense when it's that subquery that's later joined to the other table INVESTMENTS and PRICE-see below.

In that case you could say that the "reason" for it could be:

  • developer inexperience w/ SQL
  • developer experience gained on SQL platform that doesn't support table subqueries
  • developer style

It could be that some data in the tables is not normalized properly, or something similar as suggested in other comments, or it could be just plain wrong.

Here's a guess as to how perhaps it could be re-written more neatly with a subquery, followed by a another query that might help analyze the data for anomalies if that turns out to be necessary.

possible rewrite:

SELECT
    I.Symbol Symbol
,   I.Ticker CUSIP
,   I.Name Name
,   H.Quantity TotalQuantity
,   H.MarketValue TotalMarketValue
,   H.PriceLC Price
,   I.CategoryCode5 BUY_SELL
,   I.EquivFactor1 PriceTgt
,   P.LastPrice CurrPrice
,   I.AssetClass Target
,   I.Industry Industry
,   I.CategoryCode1 Risk
FROM (
    --begin holdings_secure_aggregated
    SELECT
    Symbol,
    SUM(Quantity) TotalQuantity,
    SUM(MarketValue) TotalMarketValue,
    MAX(PriceLC) PriceLC
    FROM HOLDINGS_SECURE
    WHERE Quantity > 0
    GROUP BY Symbol
) H, --end holdings_secure_aggregated
INVESTMENTS I, PRICE P
WHERE
    H.Symbol = I.Symbol
    AND I.Product = 'stock'
    AND I.CategoryCode5 NOT IN ('X', '')
    AND H.Symbol = P.Symbol
GROUP BY I.Symbol;

You can use something ugly like this to see which I.Symbol values-if any-return more than one distinct value among the columns that are aggregated using MAX, and to see precisely what those individual values are.

SELECT
    I.Symbol Symbol
,   I.Ticker CUSIP
,   I.Name Name
,   H.Quantity TotalQuantity
,   H.MarketValue TotalMarketValue
,   H.PriceLC Price
,   I.CategoryCode5 BUY_SELL
,   I.EquivFactor1 PriceTgt
,   P.LastPrice CurrPrice
,   I.AssetClass Target
,   I.Industry Industry
,   I.CategoryCode1 Risk
FROM
    HOLDINGS_SECURE H
,   INVESTMENTS I
,   PRICE P
WHERE
    H.Symbol = I.Symbol
    AND I.Product = 'stock'
    AND H.Quantity > 0
    AND I.CategoryCode5 NOT IN ('X', '')
    AND H.Symbol = P.Symbol
    AND EXISTS (
        SELECT I.Symbol
        FROM
            HOLDINGS_SECURE H
        ,   INVESTMENTS I
        ,   PRICE P
        WHERE
            H.Symbol = I.Symbol
            AND I.Product = 'stock'
            AND H.Quantity > 0
            AND I.CategoryCode5 NOT IN ('X', '')
            AND H.Symbol = P.Symbol
        GROUP BY
            I.Symbol
        HAVING (
            COUNT(DISTINCT I.Ticker)
            + COUNT(DISTINCT I.Name)
            + COUNT(DISTINCT H.PriceLC)
            + COUNT(DISTINCT I.CategoryCode5)
            + COUNT(DISTINCT I.EquivFactor1)
            + COUNT(DISTINCT P.LastPrice)
            + COUNT(DISTINCT I.AssetClass)
            + COUNT(DISTINCT I.Industry)
            + COUNT(DISTINCT I.CategoryCode1)
        )
        > 0
    );
JM Hicks
  • 364
  • 1
  • 9